In this quarter’s newsletter, we examine where bank stocks trade and their effect on bank M&A pricing.
Rising Tide?…Bank M&A Scorecard June 30, 2016
The first half of 2016 bank M&A activity is in the books and nationally there were 128 bank deals announced, slightly behind the 133 deals in 1H 2015. In the Southeast there were 24 deals in 1H 2016 compared with 26 deals in 1H 2015.
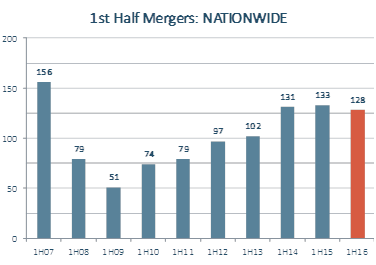
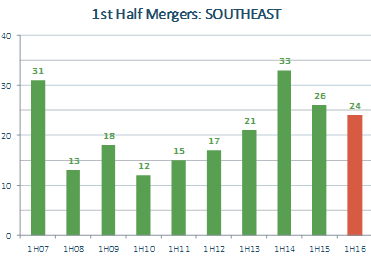
Note: All chart data courtesy of SNL financial or the FDIC.
Southeast: AL, AR, FL, GA, MS, NC, SC, TN, VA and WV
At first glance it looks as though 2016 is off to a ho-hum start, at least in terms of number of deals. Keep in mind that there are approximately 400 fewer banks today in the U.S. than one year ago, so in relative terms 1H 2016 was slightly more active than 1H 2015. Nationally, 1H 2016 was the most active first half on a relative basis (i.e. in terms of deals as a percentage of banks in existence) since 2007. In the Southeast, 1H 2016 was less active than the first halves in both 2014 and 2015 on a relative basis.
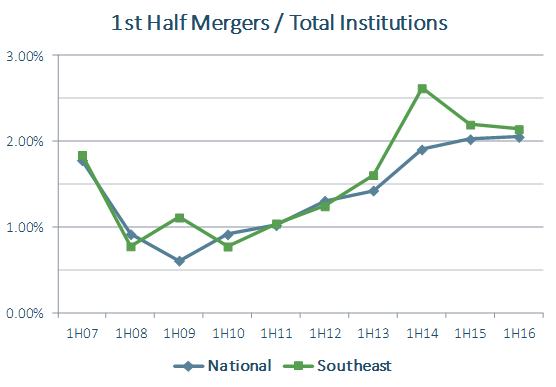
Percentages were calculated by dividing mergers in a given first half by total institutions at the end of the prior year. Southeast: AL, AR, FL, GA, MS, NC, SC, TN, VA and WV.
What About Deal Pricing?
Deal pricing in the first half of 2016 was conspicuously lower than the second half of 2015 both nationally and in the Southeast. (blue line), the 2H15 median Price/Tangible Book and Price/Deposits were 1.43x and 17.4%, respectively; in 1H16 these medians dropped to 1.32x and 15.9%, respectively. The same held in the Southeast (green line): the 2H15 median Price/Tangible Book and Price/Deposits were 1.46x and 17.5%, respectively. These medians dropped in 1H16 to 1.25x and 14.2%, respectively.
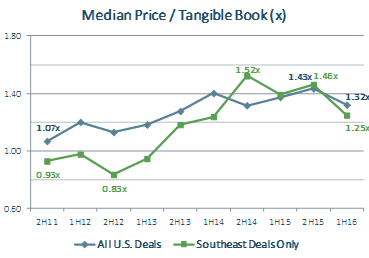
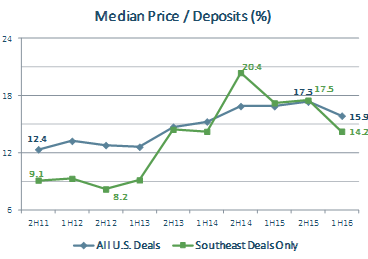
Southeast: AL, AR, FL, GA, MS, NC, SC, TN, VA and WV
What explains this noticeable drop from the second half of last year to the first half of this year? While there are a multitude of potential factors, one explanation might be found in looking at the change in bank stock values since the latter part of 2015.
The following chart looks at both bank stocks and M&A pricing on a national basis over the last five years. Bank stocks are represented by the NASDAQ Bank Index in the blue line. It is indexed at 100 beginning on June 30, 2011. The green line shows the median Price/Tangible Book pricing for all U.S. bank M&A transactions over the last five years. The data points are medians for each half-year period.
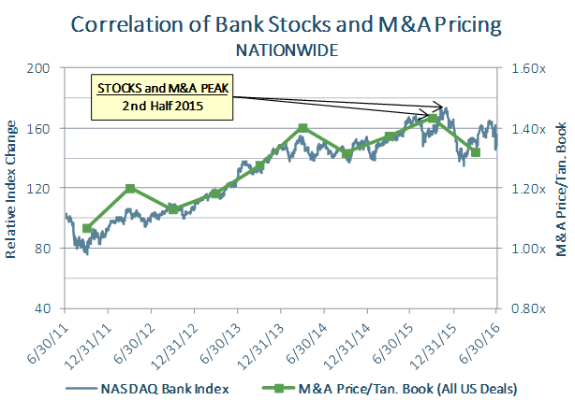
M&A Pricing are the median Price/Tangible Book values for each half-year period. NASDAQ Bank Index comprised of all NASDAQ-listed banks in the United States.
There appears to be a correlation between bank stock pricing and bank M&A pricing in that over the last five years each hit a high point in the second half of 2015 and then retreated to some degree in the first half of 2016.
Over the five year period, the NASDAQ Bank Index peaked on December 1, 2015 when it was up 73.1% compared to June 2011. As of June 30, 2016 the Index, while up 55.5% since June 2011, had clearly fallen from the December 2015 high. Meanwhile, M&A pricing topped out in the second half of 2015 at a median Price/Tangible Book of 1.43x.
The following chart takes the same analysis as above and looks just at the Southeast. Southeast bank stocks are represented by the SNL Southeast Bank Index in the blue line; constituents of this index are all exchange- and NASDAQ-listed banks located in the 12 Southeastern states. It is indexed at 100 beginning on June 30, 2011. The green line shows the median Price/Tangible Book pricing for all Southeastern bank M&A transactions over the last five years. The data points are medians for each half-year period.
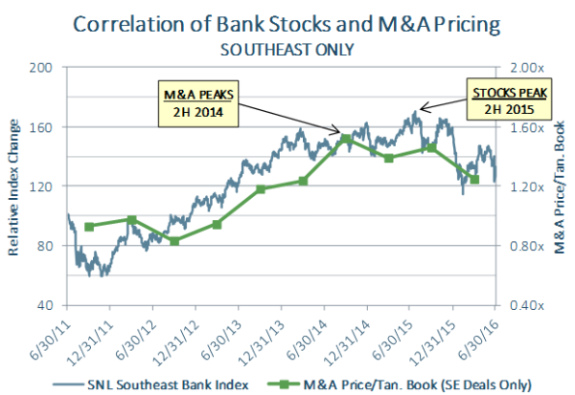
Southeast: AL, AR, FL, GA, MS, NC, SC, TN, VA and WV. M&A Pricing are the median Price/Tangible Book values for each half-year period. NASDAQ Bank Index comprised of all NASDAQ-listed banks in the United States.
The correlation between stock prices and M&A prices in the Southeast is not as strong as nationally in that the peak for M&A pricing in the Southeast occurred one year earlier than the peak for Southeastern bank stocks. Nevertheless, the general trend held where M&A pricing has followed stock prices downward in the first half of 2016. Several schools of thought exist on the influence of stock prices on M&A pricing, two of which we discuss below. One is the “rising/receding tide” sentiment which asserts that when stock prices boom they lift M&A prices with them, but when they fall they drag M&A prices down them. Another line of thinking is that if a buyer sees its stock fall, it will not turn around and offer a healthy premium to a seller. The buyer is essentially saying “My own stock is taking a beating right now, so why value the stock of this seller at some lofty level above where my stock is trading?” This stance has the obvious effect of tamping down M&A pricing.
Conclusion
In terms of activity or number of deals announced, the first half of 2016 was roughly the same as the first half of 2015. In terms of pricing, however, 2016 has started out noticeably lower than 2015. As our correlation analyses showed, one plausible explanation for this dip in M&A pricing is the dip in bank stock pricing.
Please visit our Community Bank website to learn more how Porter White can help meet your bank’s M&A and other needs.
Please contact Michael Stone, CFA (205.252.3681; michael@pwco.com) for more information on the bank M&A marketplace.
