
Size Matters
As mentioned in prior Board Briefs1 and as evidenced by the following graph reflecting Market Capitalization to Tangible Book Value (“TBV”) of all publicly traded community banks, size and scale is a proven way to enhance bank valuation2.
Price to Tangible Book Value by Bank Asset Size as of February 26, 2021
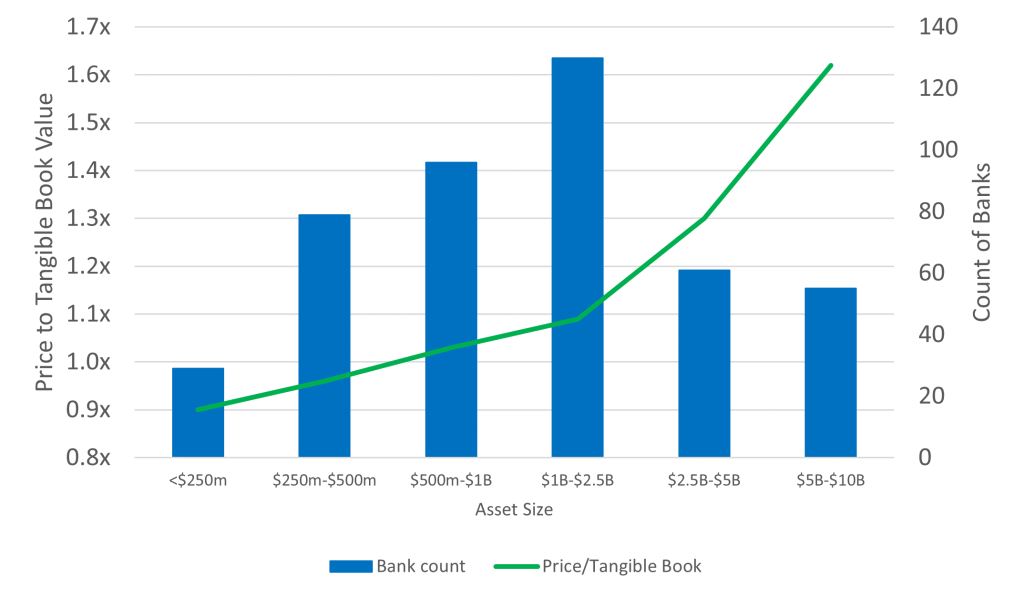
Source: S&P Global Market Intelligence
Clearly, bigger banks generate more shareholder value than smaller banks.
Quality Matters Too
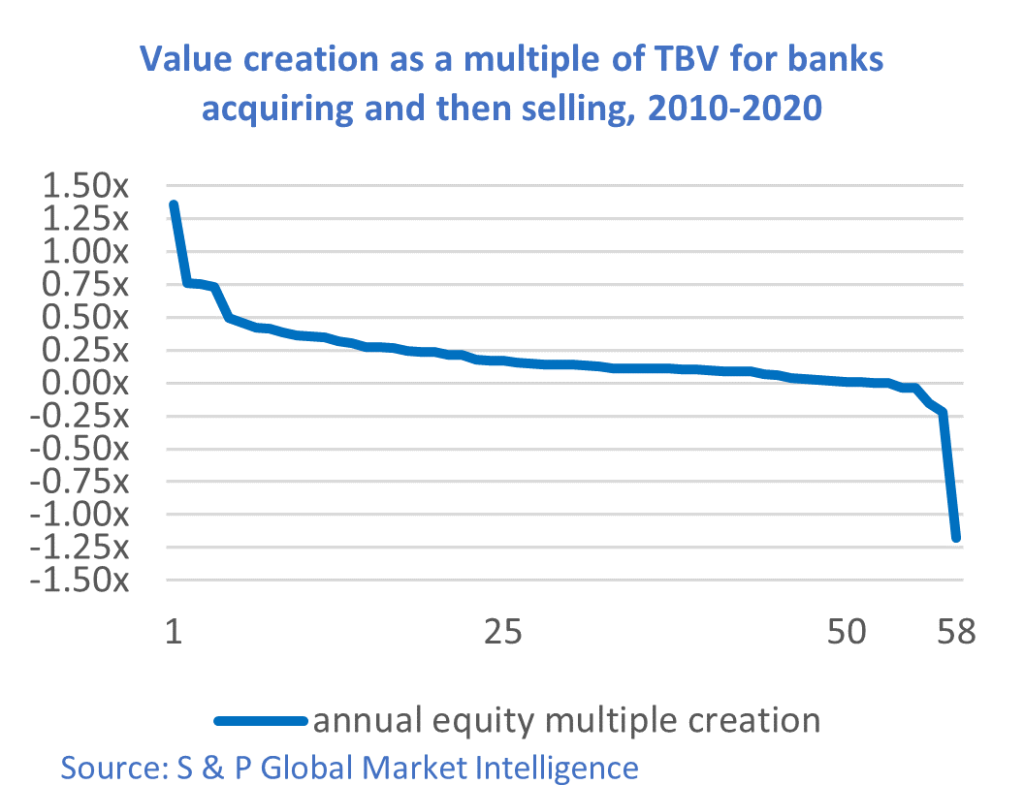
Size is important, but so is quality. The following graph shows 58 M&A transactions from 2010 to 2020 where the acquiring bank was later sold. The graph estimates annual value creation based on the difference between purchase multiples the bank paid as an acquirer, versus the selling multiple that same bank received when it sold, adjusted for the number of years between acquisitions and ultimate sale. The findings indicate 68% of the transactions generated annual valuation growth greater than 10% of TBV, while 22% of the reviewed transactions had value creation of less than 10% per annum and 10% of the deals resulted in value destruction. The lesson of this chart for acquiring banks is that a bad acquisition increases the odds that the acquirer will become the acquired before long. The balance of this article discusses how well-crafted financial models minimize the risk of low or negative shareholder value deals.
Why Financial Models Matter
Issues negatively impacting M&A performance include (i) lack of compelling strategic rationale, (ii) excessive purchase price, (iii) exaggerated synergies, (iv) inadequate due diligence, (v) poor integration, and (vi) conflicting cultures.3
Financial models will not cure these problems. But utilization of a well-designed, easy to use model will support rationale deal pricing by the acquiring bank and help address cultural challenges and improve post M&A integration as acquiring and target management teams use the model to quantify synergistic revenue and cost synergies.
Community Bank M&A Model
The following schematic reflects inputs and outputs suitable for community bank M&A models. Inputs should be tested under various purchase price, economic, market and synergy scenarios for both the standalone acquiring bank and the proposed acquisition. Acquiring bank management should focus on the purchase price with the greatest probability of providing the most favorable output and not pursue a deal unless merger driven EPS accretion meaningfully exceeds standalone bank earnings.
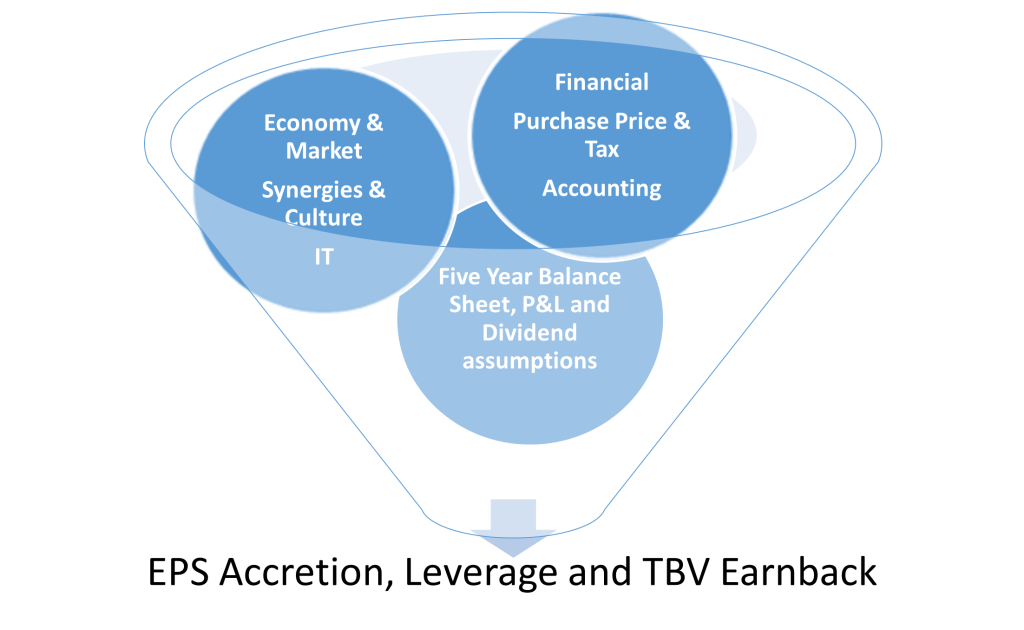
Inputs
Excel’s power is its flexibility, and the model should implement this capability in a user friendly, intuitive manner. Typical inputs are reflected in the circles above, and are designed to incorporate financial performance, market outlook and operating synergies4 into a purchase price/consideration structure compatible with return requirements of the buying and selling shareholders.
Outputs
Typical outputs are reflected in the black lettering below the inputs. Earnings Per Share accretion and leverage evidence profit and capital available to shareholders, TBV earn-back reflects TBV accretion5. EPS accretion from acquisitions needs to significantly exceed standalone bank only EPS accretion to justify acquisition risk. Modeled leverage needs to exceed the 8.50% Community Bank Leverage Ratio in 2021 and 9.00% post 2021. TBV earnback should occur in less than five years.
Summary
Well-designed financial models are essential to optimize M&A shareholder value. The quantitative outputs are helpful, but the model’s highest value is the dialogue it engenders between the acquiring and target management teams. Investment banks are proficient in modeling applications and would be happy to work with you and your bank as you develop your strategic plans.
[1] Economies of Scale in Community Banks: An FDIC Study, COVID, Capital, Scale & Opportunity: A Case for Community Bank Mergers.
[2] Community Banks defined as assets < $10 million. Tangible Equity as of 12.31.2020, Market Cap as of February 26, 2021.
[3] Why M&A deals fail, Great Prairie Group blog, June 2018. https://greatprairiegroup.com/why-ma-deals-fail/
[4] Synergies usually represent 25-30% of target expenses, Paul Murphy, CEO Cadence Bancorp, S&P Global Market Intelligence, Feb 24, 2021.
[5] The TBV earn-back period represents the number of years it takes to earn back the deal’s TBV dilution through incremental earnings. Typically, this ratio should not exceed five years. Given this ratio does not reflect underlying cashflow, the logic of its applicability to M & A valuations is somewhat tenuous. That said, it is an industry standard and should be considered4Measuring Value Creation in Bank M & A, BankDirector.com, July 2016; Is it Time to Retire Popular M&A Metrics, BankDirector.com, Feb 27, 2021.