In our last commentary (IMC 13), we looked at rebalancing an all stock portfolio. (If you didn’t read this post, you might want to review it here before continuing.) We looked at the case of an account that only included stock mutual funds. What if we included bond mutual funds in our portfolio as well? Stocks typically earn more than bonds, but bonds frequently do well when stocks are doing poorly. A portfolio with both stocks and bonds is considered “balanced” and should have more to gain from rebalancing at the right time.
I. Narrowing the Problem
As in our previous commentary, we are going to narrow the problem to what an individual might face inside their 401k account since there are usually no trading costs or tax implications. None of the investments we consider have redemption fees either. Our exercise will have stock and bond mutual funds with expected returns that are different from each other. The allocation of stock funds is similar but now consists of only ~60% of the portfolio. The remainder is invested in short term and intermediate bond funds.
We use returns from the same 7 year period starting April 1, 2007 and ending March 31, 2014. This covers the end of the last bull market, the great recession and the recent recovery. We also assume that rebalancing is “all or nothing” – i.e., either all positions are rebalanced at a time, or none are rebalanced. Our analysis is inherently limited by these assumptions and constraints.
II. A Few Scenarios
A. Simple Option: Do Nothing
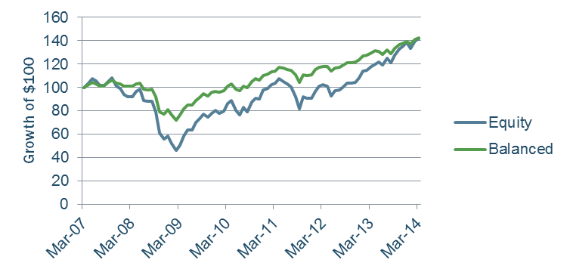
It turns out that an investor in this balanced portfolio who did not rebalance would have almost the exact same returns as the all-stock portfolio that was also not rebalanced.

The same $100 would have fallen to only $72 for the balanced portfolio (as opposed to $46 for the stock portfolio) and then recover and grow to $142. At the end of the period, the equity allocation would still be ~60%. (Stocks and bonds earned about the same over this period.) The average exposure to equities over the period was only 53%.
B. Periodic Rebalancing
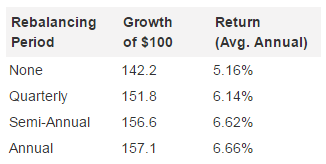
Another option would be to set up rebalancing on a monthly, quarterly or annual basis. The returns under these rebalancing scenarios are summarized in the following table.

In all cases, the rebalanced portfolios did better than the non-rebalanced portfolio. The reason for this is fairly obvious: the portfolio that is rebalanced maintains a more consistent exposure to stocks. The rebalanced portfolios maintained an average 60% allocation to stocks, where the non-rebalanced portfolio had only a 53% allocation to stocks on average over the period. Even-though stocks and bonds had the same total return over the period, rebalancing allowed the portfolio to take better advantage of the recovery in stocks.
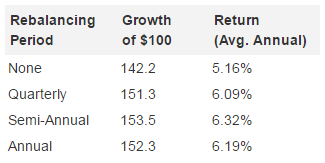
It also appears that “annual rebalancing” might be the best strategy, but a closer examination makes this less clear. One of the inherent assumptions in the results above is that the rebalancing is done only at the end of the calendar quarter or end of year. Why not rebalance once per year in June? It turns out that this result is worse. In fact, we re-ran the analysis allowing the month of the rebalancing to change (i.e., rebalance quarterly at the end of January, April, July and October). It turns out that the choice of month does matter. The average result overall month-ending periods is summarized in the table below.

It is hard to imagine that the differences between the rebalancing strategies are statistically significant; however, in all cases, some level of rebalancing was better than none.
C. Crystal Ball Approach
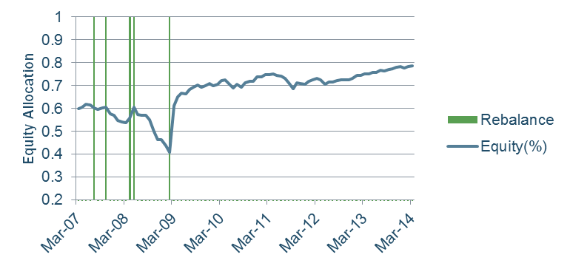
So, what is the optimal strategy? Without running an optimization routine, we expect that the best time to rebalance a balanced portfolio is at the bottom of a market (i.e., February 2009). The challenge of course, is knowing when the bottom of the market is going to be in advance! It turns out that the optimum result would have been achieved by rebalancing five times over that seven year period to achieve the best results, just as with the stock portfolio analyzed in IMC 13. The optimal rebalancing dates were at the end of July 2007, October 2007, April 2008, May 2008 and February 2009. The portfolio result would have been better than any other approach to rebalancing. The portfolio would have grown to $169.10 with an average annual return of 7.8%. The result is almost 3.5% per year better than doing nothing.
What may be surprising is that the “optimal solution” does not call for rebalancing after February 2009. The reason for this is that the bull market continued through March 2014, and while there have been some “corrections,” they have not been deep enough to warrant a decrease in stock exposure. The average exposure to stocks for the “optimal portfolio” was ~58%. The equity allocation and the rebalancing months are depicted in the graph below.

Another way to summarize the optimal strategy is as follows: rebalance a portfolio periodically up until the start of a long bull market run, and then only rebalance right before the start of a bear market that would cause the portfolio to lose those gains. In essence, to optimally rebalance a balanced portfolio, we need to know not only the beginning and end of a bear and bull market but also the magnitude of the market change in the future. We don’t think this is possible to predict in advance, and if one could, there are better strategies to make money.
III. Conclusions
Where rebalancing didn’t appear to add much value for only a stock portfolio, there does appear to be some value to rebalancing a balanced portfolio. We can never expect to time a rebalancing perfectly or know when a bull market is over before the market has dropped into bear market territory. The optimal strategy has more to do with increasing equity exposure during bull markets than it does with rebalancing.
Our intuition tells us that less frequent rebalancing (ie annually or semi-annually) is probably better than monthly or quarterly rebalancing. The most important action remains: design a good portfolio, and stick with the plan through all market cycles.
Important Notes
- Annualized returns are geometric (compound) averages.
- The S&P 500 (or any index) is not “investible.”
- Historical performance results for investment indexes, or categories, generally do not reflect the deduction of transaction or custodial charges or the deduction of an investment-management fee, the incurrence of which would have the effect of decreasing historical performance results.
- Economic factors, market conditions, and investment strategies will affect the performance of any portfolio and there are no assurances that a portfolio will match or outperform any particular index or benchmark.
- Past performance is not a guarantee of future results.
