Five years ago, the financial press was talking about the “lost decade.” The S&P 500 had not earned an investor any money, even when including dividends, for the first decade of this century (ending December 2009). While 2009 saw stocks plummet to a market low on March 9, 2009, they came back significantly by the end of the year. They did not, however, return to a level of even 10 years prior. This lost decade was a reminder that investing in stocks requires taking risks and being able to suffer minimal returns (or even losses) over long periods of time. We think it is important to look back at the lessons learned so as to not repeat some of the mistakes made by an investor investing solely in the S&P 500 during the first decade of this century.
I. Insights on the Lost Decade
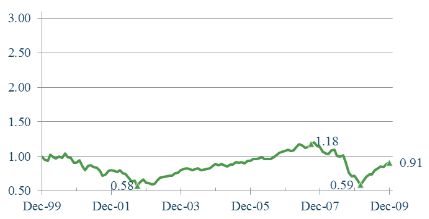
As shown in the graph below, a dollar invested in the S&P 500 would have reached a low of $0.58 in October of 2002 and then would have climbed to $1.18 as of October 2007. This in-vestment would have fallen again by the end of February 2009 to $0.59. By the end of the year, the dollar would have climbed back to only approximately $0.91.
Figure 1: Growth of $1 Invested in S&P 500
Note: Past Performance is no indication of future performance. See important disclosures at the end of this document.
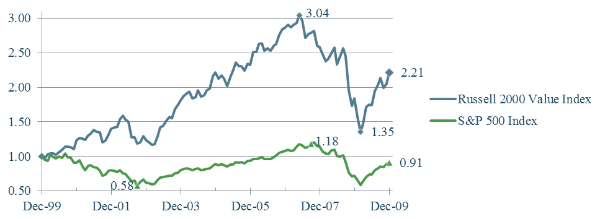
In a prior commentary, we noted that the S&P 500 was only one asset class and that had an investor been invested in more asset classes their experience might have been different. A dollar invested in US Small Value stocks (as measured by the Russell 2000 Value Index) would have grown to almost $3.04 by June 2007 but then would have fallen back to $1.35 by February 2009. US Small Value Stocks ended the decade at $2.21, which was $1.30 higher than the same dollar invested in the S&P 500.
Figure 2: Growth of $1 in US Small Value Stocks
Note: Past Performance is no indication of future performance. See important disclosures at the end of this document.
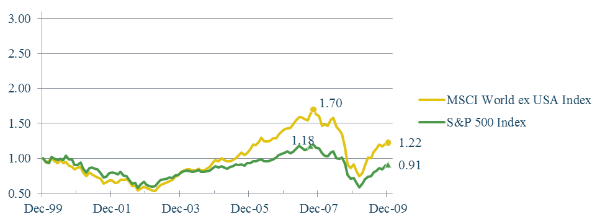
Similarly, an investment in international stocks (as measured by the MSCI World ex-USA Index) would have tracked the S&P 500 for the first four years of the decade and then outperformed, reaching a high of $1.70 towards the end of 2007. International stocks, too, would drop back below $1.00 before ending the decade at $1.22, or 31cents higher than the same dollar invested in the S&P 500.
Figure 3: Growth of $1 in International Stocks
Note: Past performance is no indication of future performance. See important disclosures at the end of this document.
It is interesting to note, however, that an investor who converted Euros to dollars for investment at the beginning of the decade and then converted his investment back into Euros at the end of the decade would have had a different return experience than a dollar-based investor. The Euro started the decade at about 1.00 Euro per U.S. dollar but ended the decade at about 1.40 Euros per dollar. This weakening of the dollar and strengthening of the Euro would have wiped out all of the returns that a Euro-based investor would have earned by investing in stocks.
II. This Decade
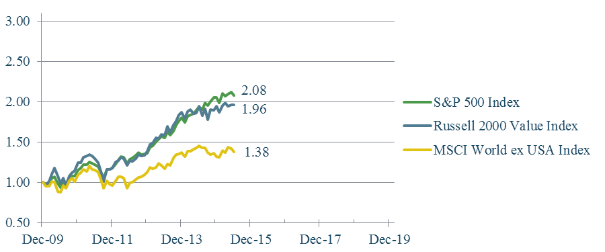
The conclusion that some might have reached by the performance of the S&P 500 in the prior decade (i.e., don’t invest in the S&P 500) would not have fared well so far this decade (nor would have a decision to invest in international stocks). As shown in the graph below, the S&P 500 Index is one of the top performing asset classes so far this decade. US Small Value Stocks have almost kept pace, but not quite. International stocks have trailed significantly, particularly in the calendar year 2014.
Figure 4: Growth of $1 in Various Asset Classes
Note: Past performance is no indication of future performance. See important disclosures at the end of this document.
As in the previous decade, a Euro-based investor would not have had the same experience either. Since the end of the decade, the dollar has strengthened significantly from around 1.43 Euros per dollar down to 1.21 Euros per dollar by the end of 2014. The Euro has weakened even further by the end of the second quarter of 2015 to close to 1.1 Euro per dollar again. It is interesting to note that the return on currency alone has been almost zero since the Euro launched in January 1999 at 1.13 Euros per dollar.
Figure 5: US Dollar / Euro Exchange Rate
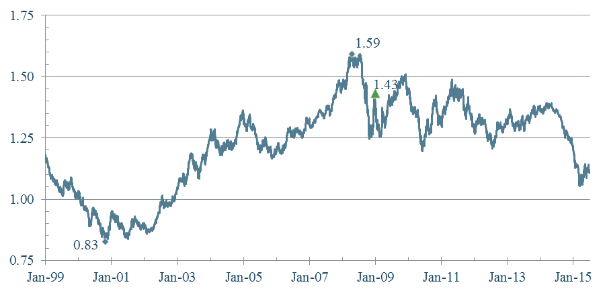
Note: Exchange rate expressed in Euros per dollar. Past performance is no indication of future performance. See important disclosures at the end of this document.
III. Concluding Thoughts
We submit these insights because it is important to remember that every investor’s time horizon is different. An investor who starts in the middle of a decade may have a very different experience from the one who starts at the beginning of the decade, even though the investment strategy is the same. It is also important to keep in mind the long-term return of currency. While in the short term investing in another currency (in addition to dollars) may enhance returns, over a longer period of time we do not expect to earn anything on currency. This also means that if we have lost money on currency in our investments in the recent past we should neither expect to gain nor continue to lose money on currency alone. We believe that all investors benefit from taking a longer term horizon, ensuring that their allocations have an appropriate amount of fixed income to allow them to ride out the inevitable volatility of equity markets and the dispersion of returns in asset classes.
We close with the SEC’s mandated (albeit true) mantra that past market returns are not necessarily harbingers of the future. Diversification of asset classes is not a guarantee against losses but usually reduces risk and is thus your friend.
Important Notes
(a) Past performance is not a guarantee of future results.
(b) The S&P 500 (or any index) is not “investible.”
(c) Historical performance results for investment indexes, or categories, generally do not reflect the deduction of transaction or custodial charges or the deduction of an investment-management fee, the incurrence of which would have the effect of decreasing historical performance results.
(d) Economic factors, market conditions, and investment strategies will affect the performance of any portfolio and there are no assurances that a portfolio will match or outperform any particular index or benchmark.
(e) Annualized returns are geometric (compound) averages.
