In an effort to manage risk and reduce volatility, investors often seek to diversify the holdings in their portfolio. Diversification is sometimes described as the only “free lunch” when it comes to investing. The idea behind diversification is that an appropriately constructed portfolio will yield equivalent or higher returns with less risk than a group of less diversified investments. The positive or neutral performance of some investments offset the negative performance of others.
One statistic used to measure the diversification of assets is “correlation.” Correlation is a measure of how the price of one asset moves in relationship to another. The strength of the relationship between the price movements falls between +1 and -1. A correlation of -1 indicates that prices move in opposite directions. Perfectly negative correlation (-1) is rare, but insurance policies are designed this way. When a negative event occurs, an insurance policy is supposed to pay to cover the damage. Conversely, when nothing happens, the insurance also does nothing. A correlation of 0 means that the price movement of assets are totally unrelated. In general, a better diversified portfolio has assets that have low or negative correlation.
Calculation of return correlations should be based on return series measured for similar periods, i.e., on an “apples to apples” basis. Returns measured less frequently are considered “stale” when comparing them to a return series measured more frequently. Using stale returns to compute a correlation statistic can lead to misleading outcomes.
An example of an index with “stale returns” is depicted below. The standard “index” is freely traded and posts the same monthly return of 1%. The stale index return is only calculated at the end of every other month and has about twice the return as the return measured monthly. On an annual basis, both indexes yield the same return, because they are the same.
Figure 1: Sample “Stale Index” Return Series

To explore the potential impact of staleness on correlation estimates, we create a hypothetical return series derived from the S&P 500 index. A “stale” index was created by grouping consecutive odd/even month pairs (e.g., January/February, July/August, etc.) and assuming a zero return to the odd month and the two-month compound return to the even month, thereby creating a return series with stale underlying asset returns.
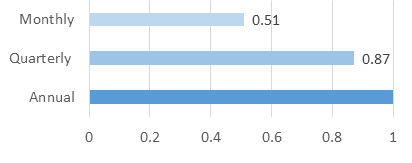
The effect of staleness on this index is evident when correlations are measured more frequently. As seen in Figure 2, the monthly correlations with the S&P 500 Index are 0.51 despite the derived index having the same total return, by construction, as the S&P 500. Correlations are higher using quarterly returns, and the index is perfectly correlated at annual frequency.
Figure 2: “Stale Index” Correlations

Note: Chart shows correlations of index data from January 1925 to December 2016.
Both the S&P 500 and the Stale Index have annualized returns of 10%.
While correlations can be useful in analyzing data, they should be just one of many tools used to help make an investment decision. This simple construct shows that the same investment (S&P 500) can have the exact same return on an annual basis but can seemingly have lower correlation if prices are not updated on the same basis. We should be similarly skeptical of other investment assets that do not provide the same pricing information that publicly traded securities do.
Real estate, private equity, or hedge funds are often believed to have low historical correlations with public equity markets. While prices are posted by the second in public markets, private assets trade infrequently, which can lead to stale prices. When assessing the diversification potential for strategies that exhibit low correlations with the market, correlation statistics may be difficult to rely upon for these illiquid assets. Because the recent price of an illiquid asset can be months old, correlation estimates with current equity markets may be unreliable in recognizing diversification advantages. It is not enough to justify an investment in a “diversifying asset” just because it has low historical correlation with other freely traded investment assets.
Important Note
There is no guarantee investment strategies will be successful. Investing involves risks including possible loss of principal. Diversification does not eliminate the risk of market loss. Concepts in this commentary come from material authored by Dimensional Fund Advisors, LP. All expressions of opinion are subject to change. This article is distributed for informational purposes, and it is not to be construed as an offer, solicitation, recommendation, or endorsement of any particular security, product, or service.
