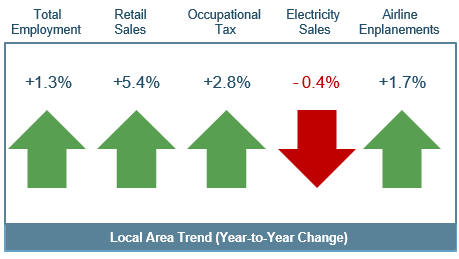
This economic update provides a snapshot of the local Birmingham economy, a prequel to our quarterly Birmingham Area Economic Report that will be published once regional and national data is made available. Each data series (number of people employed, retail sales, occupational tax collections, airport enplanements and commercial and industrial electricity sales) is sensitive to changes in economic conditions as evidenced by historical declines during and after national recessions, and each has analogs at the city, county, MSA, state or national levels. The chart below shows a local snapshot of economic findings from September 30, 2014 to September 30, 2015.
Figure 1: Local Area Trend (Year-to-Year Change) [1]

The Birmingham economy continues to improve steadily, as evidenced by continued growth in four of the five categories above; however, the Birmingham area and the State of Alabama have yet to recover from the economic recession. Within the Birmingham-Hoover MSA, Jefferson County has lost almost 30,000 jobs since January 2006 (18,000 service jobs, 12,000 goods producing jobs). The total decline is likely even worse as many “employed” persons have been forced to work part-time jobs and/or reduce the number of hours worked per week.
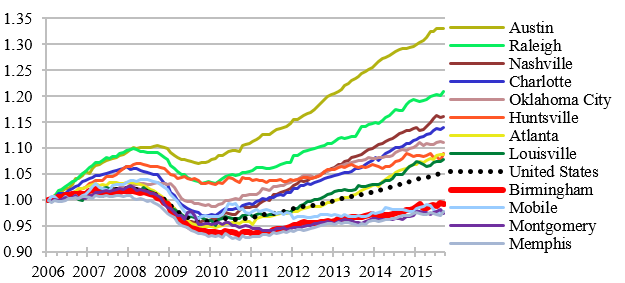
Employment, and the change in number of people employed, is the most important indicator of the health of an economy. People move or return home to a place that offers them meaningful jobs. The chart below is sorted based on total employment growth from January 2006 to September 2015 (Austin – largest growth, Memphis – smallest growth) based on peer MSAs identified by the Birmingham Business Alliance.
As shown below, the Birmingham-Hoover MSA has lagged comparable regional MSAs. (Of interest, of the MSAs listed below, only Birmingham, Huntsville, and Montgomery do not have ridesharing services –Uber or Lyft– at this time. Particularly if publicized nationally, the absence of these services in Birmingham could become a detriment to attracting new people and businesses to our area.)
Figure 2: Total Employment – Birmingham-Hoover MSA Comparison [2]

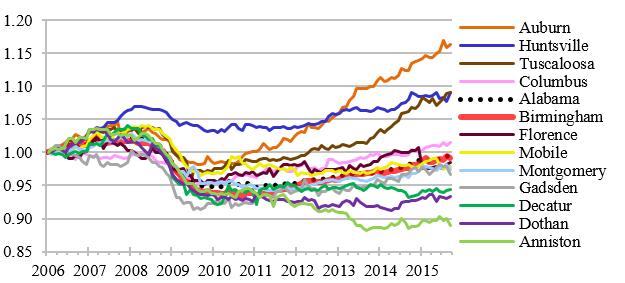
Within the state of Alabama, the Auburn-Opelika MSA has seen the largest total employment growth, while Anniston-Oxford MSA has experienced the largest decline since January 2006. Only four MSAs in Alabama (Auburn, Huntsville, Tuscaloosa, and Columbus) have reached January 2006 levels. In general, Birmingham-Hoover MSA employment growth has been about the same as Alabama’s which has lagged the U.S.
Figure 3: Total Employment – Comparison of Alabama MSAs [3]

We publish these statistics with the expectation that they will draw comment and constructive criticism, which are both welcome. PW&Co’s quarterly Birmingham Area Economic Report will be published in the coming weeks, once national and regional data becomes available.
Information in the above report should not be reproduced in any manner or used in work product without written permission from PW&Co.
[1] Local area is defined as the following for each category: Total Employment (Birmingham-Hoover MSA), Retail Sales (City of Birmingham), Occupational Tax (City of Birmingham), Electricity Sales (Birmingham-Hoover MSA), and Airline Enplanements (Birmingham Airport)[2] Figure 2. Federal Reserve Economic Data (FRED); U.S. Department of Labor, Bureau of Labor Statistics, “Current Employment Statistics – CES,” www.bls.gov/data (accessed Nov. 23, 2015).
[3] Figure 3. Federal Reserve Economic Data (FRED); U.S. Department of Labor, Bureau of Labor Statistics, “Current Employment Statistics – CES,” www.bls.gov/data (accessed Nov. 23, 2015).
