This report explores a few key statistics that paint a picture of the Birmingham area economy. Our Birmingham Area Economic Report places the Birmingham area economy in a state, regional and national context.
Click here to download the full report with a more in-depth look at the statistics.
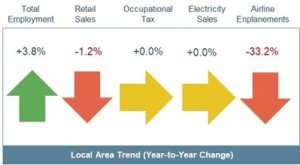
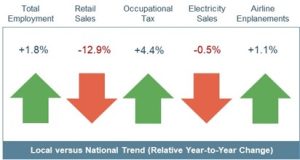
The charts below show a snapshot of local report findings. Local data is shown from June 30, 2020 to June 30, 2021. The relative performance compared to national trends is presented using data through March 31, 2021 (rather than June 30, 2021) due to a lag in the national data. Birmingham’s recent economic trends halt due to the pandemic in 2020. Birmingham’s trends have begun to show improvement compared to the nation, as evidenced by increases in three of the five categories below. The data underlying the charts is discussed in greater detail in Section III of this report.
Figure 1: Local Area Trend, Last Twelve Months as of June 30, 2021

Figure 2: Local versus National Trend (Relative Year-to-Year Change), as of March 31, 2021

In this report, Local Area is defined as the following for each category: Total Employment (Birmingham-Hoover MSA), Retail Sales (Avg. of City of Birmingham and Jefferson County), Occupational Tax (City of Birmingham), Electricity Sales (Birmingham-Hoover MSA), and Airline Enplanements (Birmingham Airport). See the full report for other relevant notes.
