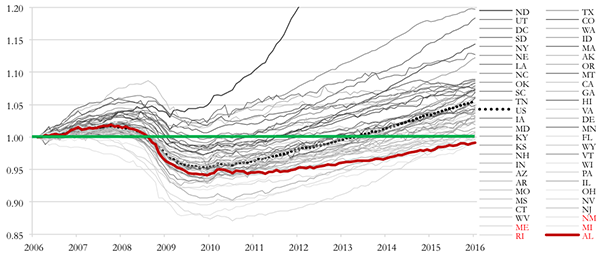
The headline news of this report is that job growth for the ten years ending March 31, 2016 in the Birmingham-Hoover MSA has lagged behind all but one comparable Southeastern MSA and that job growth for the last ten years in Alabama has lagged all other states. See Figures 3 and 4 and Sections II and III below.
I. Overview
This is the eighth edition of the Porter, White & Company Birmingham Area Economic Report, which is published quarterly. The report places the Birmingham area economy in a state, regional and national context, and focuses on the following statistical series: (A) number of people employed, (B) retail sales, (C) occupational tax collections, (D) airport enplanements and (E) commercial and industrial electricity sales.[1] Each series is sensitive to changes in economic conditions as evidenced by historical declines during and after national recessions; each has analogs at the city, county, MSA, state or national levels; and each is available reasonably soon after the end of the applicable month.
The charts below show a snapshot of local report findings. Local data is shown from March 31, 2015 to March 31, 2016. The relative performance compared to national trends is presented using data through December 31, 2015 (rather than March 31, 2016) due to a lag in the data. Changes in retail sales and occupational tax collections are calculated in constant dollars (net of inflation). If calculated on nominal dollars, percentage changes would be different.
Figure 1: Local Area Trend (Q1 2015-to-2016 Change)[2]

Figure 2: Local vs. National Trend (Relative Q4 2014-to-Q4 2015 Change)

The Birmingham economy continues to improve steadily, as evidenced by continued growth in four of the five categories above; however, the Birmingham area and the State of Alabama have not quite recovered from the Great Recession as measured by number of persons employed pre- and post-recession. The data underlying the charts is discussed in greater detail in Section IV of this report. To avoid getting lost in a sea of numbers, Sections I, III and IV of this report concentrate on the same set of statistics every quarter. Section II presents additional discussion and economic statistics that will be reported less frequently.
II. Lagging Job Growth
Growth in jobs is the most important economic indicator. Job growth leads to increased family income, in-migration of population, larger tax revenues without increasing tax rates, and economic well being. Preferably new jobs are well paid, in stable industries, and generated by businesses with good and stable market position. Alabama and the Birmingham-Hoover MSA have been recruiting jobs, but they have been losing them faster than they have been gaining them. Losses have been particularly severe in high value added mining and manufacturing. Job numbers in this report come from the Bureau of Labor Statistics via the FRED database maintained by the Federal Reserve Bank of St. Louis. While there is always the possibility of error in economic statistics, material error is less likely where, as here, the numbers are gathered over a long period of time and are made available for peer review by economists and the public.
III. State and Local Employment Activity Ending March 31, 2016
Employment, and the change in number of people employed, is the most important indicator of the health of an economy. People move or return home to a place that offers them meaningful jobs. The chart below is sorted based on total employment growth over the last 10 years from April 2006 to March 2016 (Austin – largest growth, Montgomery – smallest growth).
Figure 3: Total Employment – Birmingham-Hoover MSA Comparison[3]
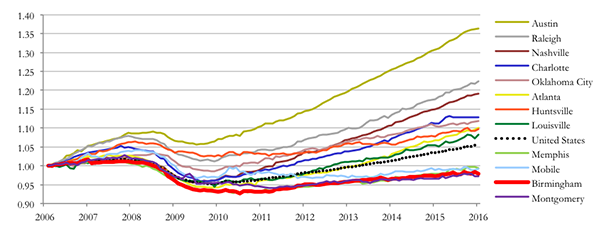
The Birmingham-Hoover MSA has lagged comparable regional MSAs. Three MSAs (Austin, Raleigh, and Nashville) never fell below 2006 employment levels during the recession. Four MSAs (three of which are located in the state of Alabama) have not yet reached April 2006 employment levels.
As shown in the figure below, the state of Alabama has lagged all other 49 states in total employment growth over the past 10 years from April 2006 to March 2016. The chart is sorted by total employment growth since April 2006, moving from left to right down the legend (largest – North Dakota, 2nd largest – Texas, smallest – Alabama). The states that are listed in red have not reached April 2006 employment levels. All five of these states are separated by less than 1%.
Figure 4: Total Employment – State of Alabama Comparison[4]
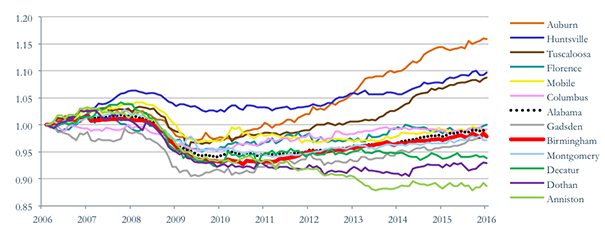
Within the state of Alabama, the Auburn-Opelika MSA has seen the largest total employment growth, while Anniston-Oxford MSA has seen the largest decline. The chart below is sorted by total employment growth over the last 10 years since April 2006. Only four MSAs in Alabama (Auburn, Huntsville, Tuscaloosa, and Florence) have reached April 2006 levels. In general, Birmingham-Hoover MSA employment growth has been about the same as Alabama’s which has lagged the U.S.
Figure 5: Total Employment – Comparison of Alabama MSAs[5]
IV. Local Birmingham Area Economic Activity Ending December 31, 2015
In an effort to provide timely access to local and national economic data, we have updated our report to provide comparative national statistics to local economic indicators on a one quarter lag. This section places the Birmingham area economy in a state, regional and national context, and focuses on the following statistical series: (A) number of people employed, (B) retail sales, (C) occupational tax collections, (D) airport enplanements and (E) commercial and industrial electricity sales.
A. Employment
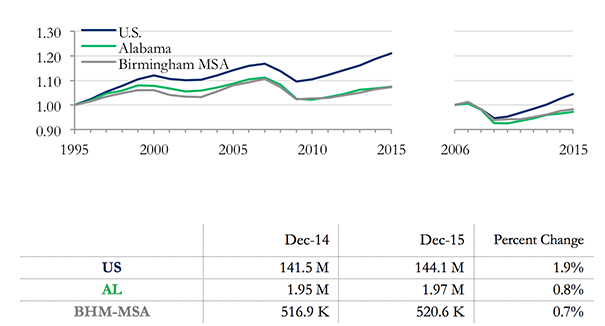
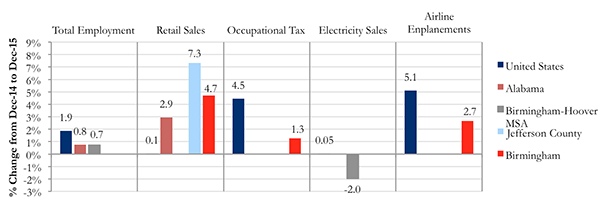
As of December 31, 2015, the number of people employed in the United States had recovered to the previous high level (although the percentage of population in the labor force was still at a post-recession low). In the Birmingham-Hoover MSA and the State of Alabama, however, the number of people employed has not reached full recovery, and the rate of growth is lagging be-hind the U.S. as a whole.
Figure 6: Total Employment – Birmingham-Hoover MSA, State of Alabama, and U.S.[6]
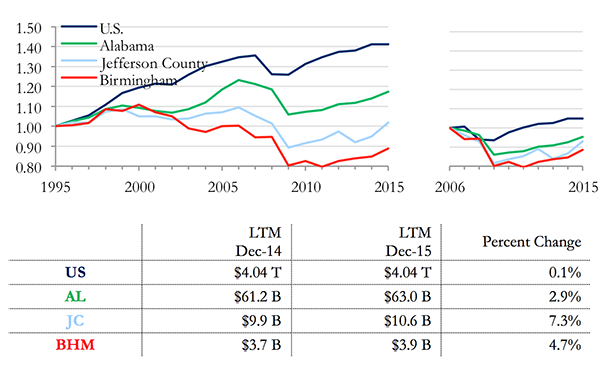
B. Retail Sales
Retail sales are important in Alabama as a sign of economic activity and an important source of governmental revenue from sales taxes. For the recent 12 months period, Alabama, as well as Jefferson County and Birmingham MSA, have outpaced the rate of growth of the U.S., using personal consumption of durable and non-durable goods (omitting personal services) as the analog for U.S. sales. Retail sales in the City of Birmingham remain below 1994 levels, while Jefferson County retail sales are just below 1994 levels. According to the data, Jefferson County shows a very high growth rate over the past twelve months, but it should be noted that some of the growth can be attributed to uneven collections that may not be representative of the actual time period. Unofficial estimates are closer to the growth rate of the state.
Figure 7: Retail Sales – Birmingham, Jefferson County, State of Alabama, and U.S.[7]
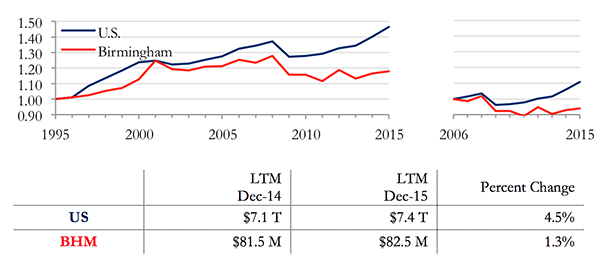
C. Birmingham Occupational Tax
The occupational tax in the City of Birmingham has been on a gradual downward trend in real terms since about 2007, but it shows signs of increasing in the recent period, nearing the pre-recession levels. The Birmingham occupational tax lagged behind but generally followed the trend of U.S. wages from 1994 to 2007 and then declined along with U.S. wages through 2010. Over the last twelve months, Birmingham occupational tax collections increased 1.3%, which still lagged the United States. U.S. wages are used as a proxy for a U.S. occupational tax in the absence of comparable real data.
Figure 8: City of Birmingham Occupational Tax Collection[8]
D. Airport Enplanements
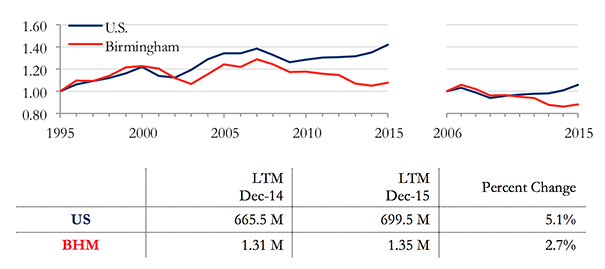
Data on airport enplanements are relevant indicators of economic activity. However, a number of factors influence airport enplanements other than local economic activity. These factors include airline consolidations resulting in route changes that reduce service and competitive airline ticket prices from other surrounding airports.
For a number of years, Birmingham enplanements followed national trends, diverging after 2010 as national enplanements continued modest increases while Birmingham enplanements experienced a marked decline. Over the last twelve months, Birmingham-Shuttlesworth International Airport’s enplanements have appeared to stabilize with modest increase of 2.7%, while the total domestic enplanements in the U.S. increased 5.1%.
Figure 9: Passenger Enplanements – Birmingham-Shuttlesworth International Airport and U.S.[9]
E. Commercial & Industrial Electricity Sales
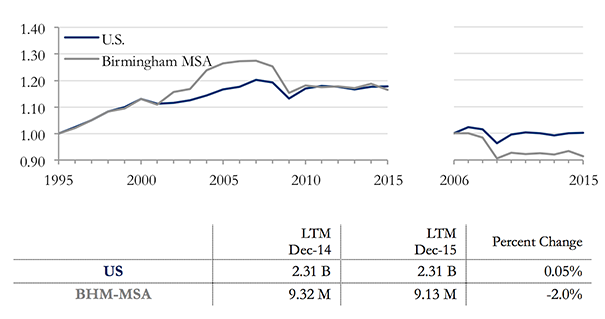
Economic growth leads to, and is frequently enabled by, increased consumption of electricity. From 1994 up to the beginning of the recent recession, Alabama Power booked increases in commercial and industrial electricity sales from the company’s Birmingham division (roughly comparable to the area covered by the Birmingham-Hoover MSA) at a higher rate than the nation as a whole. Commencing with the recession, however, the company’s Birmingham division experienced a larger reduction in consumption than was recorded for the U.S. as a whole. Over the last twelve months, the Birmingham division’s electricity consumption has declined by 2.0%, while the U.S consumption grew slightly over the same time period. Electricity data has not been adjusted for cooling days.
Figure 10: Commercial & Industrial Electricity Sales (MW-Hrs) – Birmingham Division and U.S.[10]
V. Summary
Changes in the selected statistics over the last two years (ending December 31st) are summarized in the graph below.
Figure 11: Comparative Economic Summary by Area
We publish these statistics with the expectation that they will draw comment and constructive criticism, which are both welcome.
[2] Local area is defined as the following for each category: Total Employment (Birmingham-Hoover MSA), Retail Sales (City of Birmingham), Occupational Tax (City of Birmingham), Electricity Sales (Birmingham-Hoover MSA), and Airline Enplanements (Birmingham Airport)
[3] Figure 3. Federal Reserve Economic Data (FRED); U.S. Department of Labor, Bureau of Labor Statistics, “Current Employ-ment Statistics – CES,” www.bls.gov/data (accessed July 7, 2016).
[4] Figure 4. Federal Reserve Economic Data (FRED); U.S. Department of Labor, Bureau of Labor Statistics, “Current Employ-ment Statistics – CES,” www.bls.gov/data (accessed July 7, 2016).
[5] Figure 5. Federal Reserve Economic Data (FRED); U.S. Department of Labor, Bureau of Labor Statistics, “Current Employ-ment Statistics – CES,” www.bls.gov/data (accessed July 7, 2016).
[6] Figure 6. Federal Reserve Economic Data (FRED); U.S. Department of Labor, Bureau of Labor Statistics, “Current Employ-ment Statistics – CES,” www.bls.gov/data (accessed July 7, 2016).
[7] Figure 7. U.S. personal consumption (goods) is used as a proxy for U.S. sales. U.S. Department of Commerce, Bureau of Economic Analysis. “Table 2.3.5. Personal Consumption Expenditures by Major Type of Product.” http://www.bea.gov/iTable/iTable.cfm?ReqID=9&step=1#reqid=9&step=1&isuri=1 (accessed July 7, 2016); Alabama Department of Revenue “Monthly Revenue Abstracts,” http://revenue.alabama.gov/datapress-abstract.cfm (accessed February 16, 2016); Jefferson County Department of Revenue (personal communication, June 28, 2016); City of Birmingham Finance Department, “City of Birmingham Financial Report,” Monthly Blue Books, 1994-2016.
[8] Figure 8. U.S. Wages is used as a proxy for national occupational tax collection. U.S. Wages are estimated for the third quarter of 2015. Bureau of Labor Statistics, U.S. Department of Labor, “Quarterly Census of Employment and Wages,” www.bls.gov/cew (accessed July 7, 2016). City of Birmingham Finance Department. “City of Birmingham Financial Report.” Monthly Blue Book. 1994-2016.
[9] Figure 9. Birmingham Airport Authority, “BHM Monthly Statistical Reports,” http://www.flybirmingham.com /aboutbhm-reports.shtml (accessed July 7, 2016); U.S. Department of Transportation, Bureau of Transportation Statistics,”U.S. Air Carrier Traffic Statistics,” BTS.gov. http://www.rita.dot.gov/bts/acts (accessed July 7, 2016).
[10] Figure 10. U.S. Energy Information Administration (EIA), “Independent Statistics and Analysis,” http://www.eia.gov /electricity /data.cfm#sales (accessed July 7, 2016); Alabama Power Company (personal communication, June 28, 2016). Data has not been adjusted for cooling days.
