Click here for the PDF.
In This Issue
In “Trump Bump?…2016 Bank M&A Scorecard,” we discuss how M&A in 2016 was down compared to 2015 but wonder if the November election could be a boon to 2017 bank M&A.
In “CRE Concentration Considerations,” we review an issue a number of banks are contending with in their loan portfolios.
Trump Bump?…2016 Bank M&A Scorecard
2016 is in the books and will undoubtedly go down as one of the most fascinating years in American history. The banking industry keenly followed the presidential election as the two major party candidates presented extremely divergent views on the banking industry.
In the bank M&A arena, the number of deals as well as deal pricing both backpedaled compared to 2015.
Deal Flow Regresses
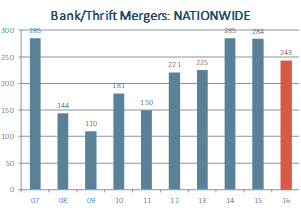
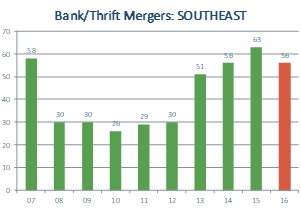
Nationally there were 243 bank M&A deals announced in 2016, a significant drop from the 284 deals announced in 2015. A drop occurred in the Southeast as well with 56 deals announced in 2016, down from 63 announced in 2015.
Note: All chart data courtesy of SNL Financial.
Southeast: AL, AR, FL, GA, MS, NC, SC, TN, VA and WV.
Not only did deal activity fall from 2015 to 2016 in absolute terms, it fell in relative terms as well. The following chart shows that M&A deals as a percentage of total banks decreased in 2016 compared to 2015 on both a national basis and a regional basis. We present this analysis over the last quarter century to keep some perspective: while relative deal activity fell in 2016, it was still at a level not seen by and large since the late 1990’s.
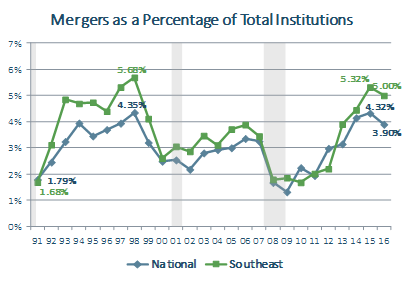
Grey bars represent recessions (Jul90-Mar91; Mar01-Nov01; and Dec07-Mar09). Percentages were calculated by dividing mergers in a given year by total institutions at Dec. 31 of the prior year. Southeast: AL, AR, FL, GA, MS, NC, SC, TN, VA and WV.
Deal Pricing Falls Too
Deal pricing decreased in 2016 compared to 2015. The median price/tangible for deals nationally was 1.34x (down from 1.41x in 2015) and for deals in the Southeast it was 1.29x (down from 1.42x in 2015).
In fact, the trend in deal pricing coming out of the Great Recession has been underwhelming, at least compared to previous post-recession periods. The chart below shows deal pricing roared upward following both the 1990-91 and 2001 recessions; compare those recoveries with the almost flat trajectory of pricing following the 2007-09 recession.
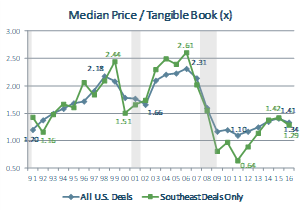
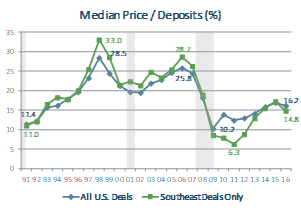
Southeast: AL, AR, FL, GA, MS, NC, SC, TN, VA and WV. Note: Price-Earnings multiples not shown due to the abnormally high preponderance of sellers with little or negative earnings in the 2009-11 period.
Will the Trump Bump Drag Along M&A Pricing?
Something to keep an eye on as we move through 2017 is where banks stocks trade. One school of thought in the bank M&A world is that bank M&A pricing “tags along” with bank stock prices: as stocks rise, M&A multiples rise and vice versa.
Beginning on the day immediately following the election (November 9, 2016), bank stocks took off like a rocket ship in what has been referred to as the “Trump Bump.” The explanation behind this phenomenon is that the newly elected candidate is viewed as far-friendlier to the banking industry than his opponent, and market participants reflected this thinking in their trading of bank stocks. The chart below shows the almost vertical rise of bank stocks (blue line) from November 9th to December 31st.
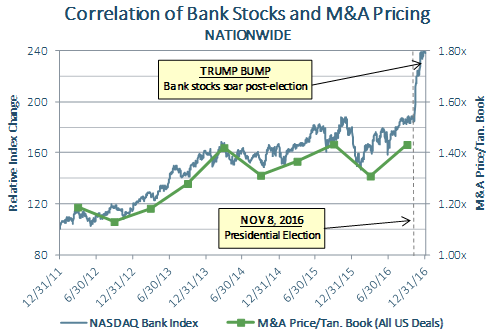
If the school of thought regarding the stocks-M&A multiples relationship holds, and if bank stocks continue to rise or hold steady, M&A pricing in 2017 could enjoy an upward trajectory.
Please contact Michael Stone, CFA (205.252.3681; michael@pwco.com) for more information on the bank M&A marketplace.
CRE Concentration Considerations
Recent regulatory scrutiny of commercial real estate (CRE) loan concentration should come as no surprise to any bank executive, director, or investor. CRE concentration alone does not indicate heightened risk to a banking institution’s capital base; however, lenders that are above, or approaching, interagency guidance thresholds have undoubtedly been asked by their regulators to demonstrate the level of portfolio and credit risk management processes in place in order to track and mitigate potential risks resulting from such concentrations.
In December 2015, citing increased loan originations, competitive market pressures, and weakening underwriting standards, the Board of Governors of the Federal Reserve System, the Federal Deposit Insurance Corporation, and the Office of the Comptroller of the Currency issued an interagency statement regarding prudent risk management for CRE lending and renewed attention to its guidance issued in 2006 related to CRE concentration.
The 2006 guidance addresses the risks of concentration in CRE lending by specifically citing two supervisory criteria: (1) aggregate loans for land acquisition, construction, and development (ADC) in excess of 100% of a banking institution’s total risk-based capital; and, (2) total non-owner-occupied CRE loans (including ADC loans) in excess of 300% of a bank’s risk-based capital, AND growth in CRE lending of 50% or more during the prior 36 months.
Regardless of the perceived suitability of interagency guidance criteria, or if a bank maintains a sophisticated credit risk management framework in place, the current spotlight on CRE concentration from regulators is not going away—listen to just about any 3rd quarter earnings call for further confirmation. Therefore, banks of all shapes and sizes need to fully understand how (and why) its regulators view the risks associated with increased CRE concentration, and what measures they deem necessary to protect a bank, its shareholders, and its depositors against significant adjustments in prevailing CRE market conditions.
It is important to note that the supervisory concentration thresholds do not constitute a “hard limit” on the size of a CRE loan portfolio, rather, they establish levels at which enhanced risk management practices should be followed, including but not limited to, loan-level and CRE portfolio stress-testing. If a bank is operating with CRE concentrations above the supervisory thresholds, and its regulators are not satisfied with its portfolio and risk management processes, then it may be identified for further supervisory examination. In certain cases, a bank may be required to raise new capital, or maintain existing capital well above “well-capitalized” minimums, to compensate for the perceived risk of increased future credit losses as a result of disruptions in commercial real estate markets.
In order to show that a banking institution fully understands the risks in its CRE portfolio, practical credit risk management procedures must include a comprehensive, bottom-up approach to segmentation and management of its loan portfolio. Even if a bank’s CRE concentration is nowhere near the guidance criteria, industry standard best-practices of identifying, quantifying, and managing risks associated with CRE lending can be applied to other loan segments to establish the foundation of a sound bank-wide credit risk management framework.
Segmentation involves properly capturing and classifying loans by product type, loan purpose, geography, industry, collateral type, market correlation, and any other descriptive or quantifiable category. Credit risk management uses that data to track the loan portfolio over time against certain benchmarks and other leading economic indicators to ensure an appropriate risk-adjusted return is achieved, as well as to establish a proper allowance for loan losses (ALLL). Going further, managing unsystematic credit risk involves examining asset quality over time, specifically by loan performance, credit exceptions, risk-rating migration, as well as changes in collateral value, occupancy rates, rental rates and operating expenses.
Overall, it appears that renewed regulatory focus on CRE concentration, combined with increased capital reserves required for so-called High Volatility Commercial Real Estate (HVCRE), has caused some banks to be much more judicious in extending CRE loans, and in some cases pulling back entirely from the segment. As a result, for the active players still in the market, whether by capacity or capability, the current market is demonstrating lower overall competition, and even some pricing relief, which should be welcome news on the heels of an extended low-rate and crowded lending environment.
