Robert Schiller, author of “Irrational Exuberance” and recent Nobel Prize winner, has been credited with predicting the last two market crashes. His preferred metric of value for the stock market is the “Cyclically Adjusted Price Earnings (CAPE)” ratio. He makes the CAPE ratio and data underlying it available on his web page. As shown in his chart below, the CAPE ratio reaches peaks before the market crashes of 1929 and 2000. It also bottoms out just before the bull market run starts in 1981 when interest rates reached their most recent peak.
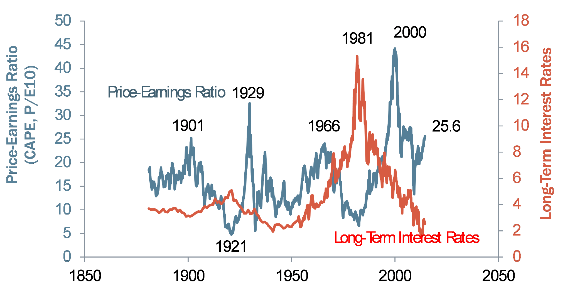
Equity markets (as measured by the S&P 500) have had strong returns for the last 5 years. Can the Schiller P/E ratio help us predict the next downturn? This white paper uses historical price and earnings data to conduct some “what if” experiments to see if the CAPE ratio can be used to improve long-term portfolio performance.
I. What is the Schiller P/E?
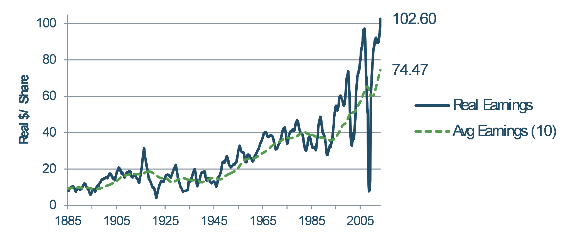
The Schiller P/E, or Cyclically Adjusted Price Earnings (CAPE) ratio, is calculated using the current index price divided by the 10 year average earnings (adjusted for inflation). Because earnings are averaged, it is much less sensitive to changes in corporate earnings than changes in the price of the index. As shown in the following graph, the 10 year average of earnings (as of December 2013) is significantly below the current level of earnings. What is possibly more interesting is that earnings have returned to their previous peak on an inflation-adjusted basis.
II. Developing a Trading Strategy
The graphical representations are effective at pointing out market peaks. The challenge is to be able to identify them in advance and trade opportunistically. In order to benefit from this “market signal,” an investor must determine when to sell and when to buy again. Frequently we are told that a client wants to get out of the market (because it is too rich) and get back in “when things get better.” The second part of the strategy is as hard to execute as the first. This section describes some strategies that one could imagine might work.
A. “Sell Signal”
One simple strategy might be to stay out of the stock market when the CAPE ratio is above its long term moving average. For example, this could be a long term average equal to the last 20 or 30 years. As shown in the graph below, this long term moving average has changed over time staying close to 15x until the mid-1990s and then increasing to ~25x once the “dot-com bubble” is factored in.
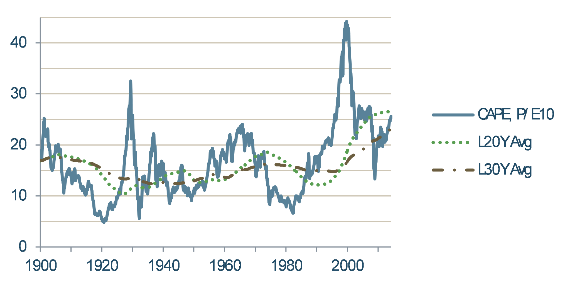
Another strategy would be to “stay out of crazy markets,” or when the CAPE ratio is above 25x. This happened at the end of the roaring 20s and during the dot-com bubble. Recently, the CAPE ratio crossed the 25x threshold again.
B. “Buy Signal”
To keep our strategy simple, we use the same signal to get back into the market as we used to get out of the market. For example, if we got out of the market when the CAPE crossed 25x, we will get back in when it falls below the same level. For the moving averages, we would allow these to fluctuate over time and would buy back into the market when the current CAPE fell below the current moving average.
C. Evaluating Our Trading Strategy
How do we know if the trading strategy is working? It is more difficult to evaluate a portfolio when its exposure to the market changes significantly depending on the time period. The following metrics are still relevant:
- How much did the portfolio grow as compared to the comparable static portfolio?
- What is the maximum annual loss of the portfolio?
We will refer to our portfolios that adopt a trading strategy as the “tactical portfolios.” The “comparable static portfolios” will be a buy and hold strategy which has the same average exposure to the market. For example, if the tactical strategy is out of the market 20% of the time on average, we will compare it to a benchmark with a 20% exposure to treasury bills and 80% exposure to the S&P 500, rebalanced on a monthly basis. Also, we are going to ignore taxes, trading costs, market impact costs and a whole number of other considerations that could skew the analysis (likely to the detriment of a tactical portfolio).
III. Results – January 1950 to May 2014
A. Portfolio Growth
It turns out that the portfolios that stayed out of the market when the CAPE was above the threshold level performed fairly well compared to a comparable static portfolio. During this period, the market was actually above its long term average more than half of the time, so the tactical portfolios spent a lot of time invested in t-bills. The higher absolute threshold of “greater than 25x” only occurs ~17% of the time, but its comparable results are also fairly good.
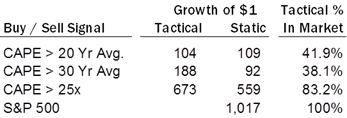
Interestingly, the S&P 500 grew from $1 to over $1,000 during this same time period, so being out of the market certainly had its cost.
B. Portfolio Risk – Maximum Annual Loss
The portfolio risk characteristics for the tactical portfolios are far less favorable. These portfolios failed to avoid the largest periods of “market correction” during the applicable time period. The static portfolios, with a fixed allocation to treasury bills, had a much lower level of maximum annual loss than the tactical portfolios. In fact, two of the tactical portfolios had the same maximum annual loss as the S&P 500, occurring during the great recession.
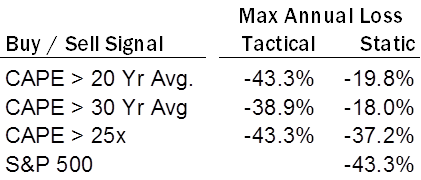
It turns out that the CAPE ratio fell below its 20 year moving average and 25x at the beginning of 2008 (and below its 30 year average in August 2008). This could not have been a worse time to buy into the market. Imagine having been out of the market since 2003 or earlier, having watched the S&P 500 grow by 60% or more, and still remained committed to that strategy?
The following graph superimposes the growth of $1 (since 1979) of the tactical strategy and the S&P 500 onto the time periods when the CAPE ratio was above 25x. As you can see, the tactical portfolio avoids the dot-com sell off, but not the sell-off in the fall of 2008 / Spring 2009.
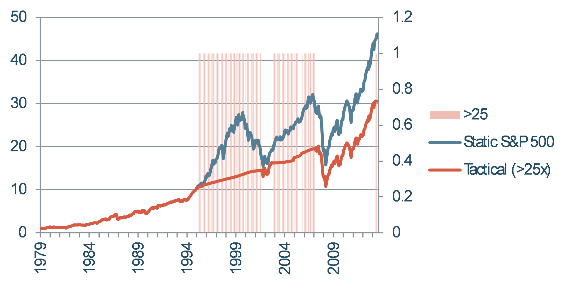
Vertical bars represent periods when the “>25x” tactical strategy led to being out of the equity markets.
IV. Conclusions
There are a few conclusions that we take away from this analysis:
- Looking back, it is easy to point out when the market was “over-valued.” It is much harder to design a trading strategy that works in all market environments.
- Tactical strategies introduce different kinds of risk, and they cannot reduce risk in the same way as adding fixed income to a portfolio.
- Markets may be overvalued right now and may have entered a “danger zone,” but there is still uncertainty about future changes in market prices.
- Schiller’s CAPE ratio is not a “silver bullet” in predicting market prices.
These conclusions are supported by published works subject to peer review.[1] John Maynard Keynes is not well regarded in some circles for his macroeconomic prescriptions. However, it is well to remember that he was an astute and highly successful investor. Commenting on the strategy of selling equities when the markets appear irrational, Keynes noted,
“Markets can remain irrational longer than you can remain solvent.”
It is hard to bet against the market. We advise our clients to take stock market risk when they need the potential return above less risky assets. Once they have accumulated sufficient returns, or their needs change, we then look at reducing risk. This timing is based on their circumstances, not the valuation of the market.
Important Notes
(a) Past performance is not a guarantee of future results.
(b) The S&P 500 (or any index) is not “investible.”
(c) Historical performance results for investment indexes, or categories, generally do not reflect the deduction of transaction or custodial charges or the deduction of an investment management fee, the incurrence of which would have the effect of decreasing historical performance results.
(d) Economic factors, market conditions, and investment strategies will affect the performance of any portfolio and there are no assurances that a portfolio will match or outperform any particular index or benchmark.
