Many people find the performance of bonds, and particularly bond funds, confusing. We know that if we buy a bond for $100 that matures in 5 years and pays a $5 coupon (or 5% yield), then we will earn 5% if we hold that bond to maturity. (I am assuming that the bond does not default and am ignoring what we do with the coupon once it is paid.) What if we hold a mutual fund that owns a portfolio of bonds that have an average maturity of 5 years?
Inside a bond fund, there are bonds of varying duration (the average timing of payments of coupons and bond principal). When one matures, another one is purchased at the longer end of the range to keep the average holding to five years. (For this example, I am assuming the fund is an index fund of treasuries with a target average maturity of 5 years.) Since bonds are constantly maturing and new ones are being purchased, understanding the returns of the portfolio becomes a little more complicated.
Today (actually, both as of the end of December 2016 and March 2017), the 5 year Treasury Rate is ~1.93%. If we hold a bond portfolio that tracks the Barclays Intermediate US Government Bond Index (the “Bond Index”) that has a duration of ~4 years, will it have a return of 1.93%? It is impossible to predict the future with certainty, but we can look at the past.
As of December 31, 2016, the Bond Index generated a 1.04% annualized return over the 5 year period starting on December 31, 2011. It turns out that the 5 year Treasury rate as of December 31, 2011 (i.e., 5 years ago), was 0.83%, or a difference of 0.21%. While not a perfect predictor, in the context of predicting the future, that kind of error is actually not that bad.
Figure 1: Past Yields and Current Returns

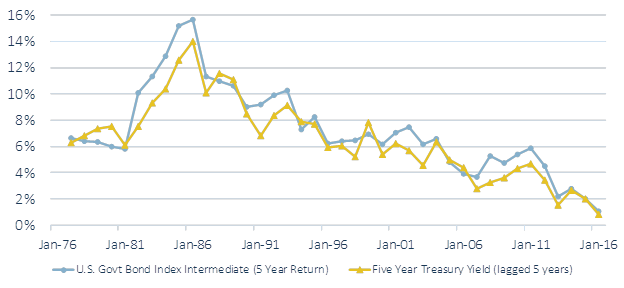
The 5 Year Treasury Rate as of December 2011 is considered a “5 Year Lagged Rate” as of December 2016. We can then do this same comparison for each year back to 1977, the first 5 year period that the Bond Index data is available. The results of these comparisons are shown in the following graph.
Figure 2: Historical Returns vs. Lagged Treasury Rates

Just looking at the graph above, it appears that the 5 Year Lagged Rate tracks the Bond Index return fairly closely. In most years, the Lagged Rate appears to be below the actual return, but in some years it is above. Using statistical techniques (linear regression), we calculate the Lagged Rate explains ~95% of the variation in the realized return of the Bond Index.
We can conclude from this analysis that today’s current interest rates are a pretty good (but not perfect) predictor of the future. If we are a buy-and-hold investor in bonds, we can look at today’s rates to estimate what we might earn over different time periods, and we should not expect our returns to be much higher or lower.
Important Note
Past performance is not a guarantee of future results. Indices are not available for direct investment; therefore, their performance does not reflect the expenses associated with the management of an actual portfolio. There is no guarantee that an investing strategy will be successful.
[IMC 23]