Overview
In December 2020, the FDIC produced a staff study entitled Economies of Scale in Community Banks1 which concluded community banks generate 90% of potential efficiency gains when a bank’s loan portfolio reaches $300 million and continue to accrue cost savings until the portfolio reaches $3.3 billion, at which time unit cost begin to increase. This article will summarize these findings and will speak to the relevance of this paper to today’s Alabama Community Bankers.
Economies of Scale
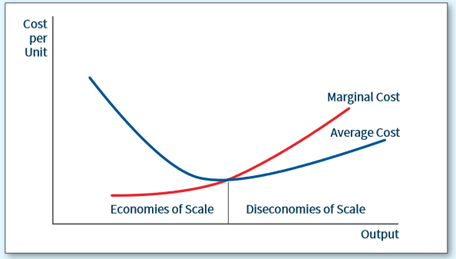
Scale economies occur when the per unit cost of production inputs falls as the level of output increases. As reflected below, economic theory states unit costs will fall as production rises until a certain point, at which underlying unit costs rise due to inefficiencies. In this study, the FDIC assumed production Inputs are labor, deposits, physical assets and credit capital, Output is loan production. An efficient bank operates where the marginal cost of one additional loan equals the average cost to produce that loan. As will be demonstrated in this article, this concept is reflected in the FDIC findings for community banks.
Scale Economies: Cost per Unit Versus Level of Output

Source Data and Unit Cost Definitions
The FDIC utilized Call Report and CAMELs data from 2000 to 2019 on all banks with assets under $10 billion to assess the impact of loan portfolio size and credit quality on a bank’s underlying cost structure. Specialty lenders such as credit card, Ag lenders or Mortgage brokers were excluded. Porter, White & Co estimates this total approximately 120,000 data points2. Scale inputs and outputs discussed above were derived from the following Call Report fields:
| Input/Output | Call Report field |
| Labor | Salaries & Benefits |
| Deposits | Interest Expense on deposits |
| Physical assets | Premises & Fixed Asset expense |
| Credit capital | Provision for Credit Losses |
| Loan production | Total Loans & Leases (ex HFS) |
Findings
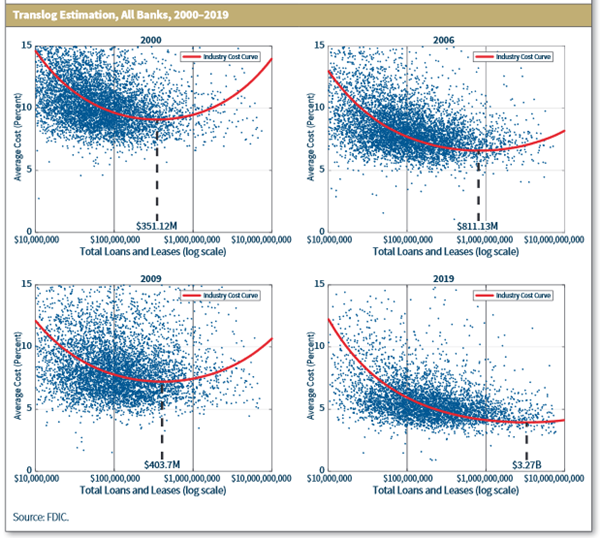
For every bank in the database, the FDIC determined each bank’s average cost by adding the inputs together, dividing that sum into total loans, and plotting the result onto a graph which reflected loan size and average cost of every community bank for that given year. The study provided four major findings, as reflected in Chart B and C below:
- The Cost Curve is real: As reflected in the U-shaped curves in the graphs below, banks of a certain size have a real cost advantage over smaller competitors in all economic scenarios and carry lower costs than larger banks in recessions.
- Credit trumps everything: In recessions, banks with higher credit costs suffer. In the Great Recession, larger community banks often held large construction related portfolios and carried high provision costs, resulting in higher unit cost for those banks. As a result, smaller portfolios optimized cost realization as reflected in the fall in optimal portfolio size from $811 million in 2006 to $404 million in 2009.
- Size matters: In today’s environment of very low interest rates, benign credit and rapidly improving technology, larger loan portfolios lower unit costs at a much greater rate than prior years. See 2019 below, where the optimal portfolio has grown from $404 million in 2009 to $3.2 billion in 2019 providing an average unit cost of 3.9% of total loans versus 7.0% for the optimal portfolio in 2009.
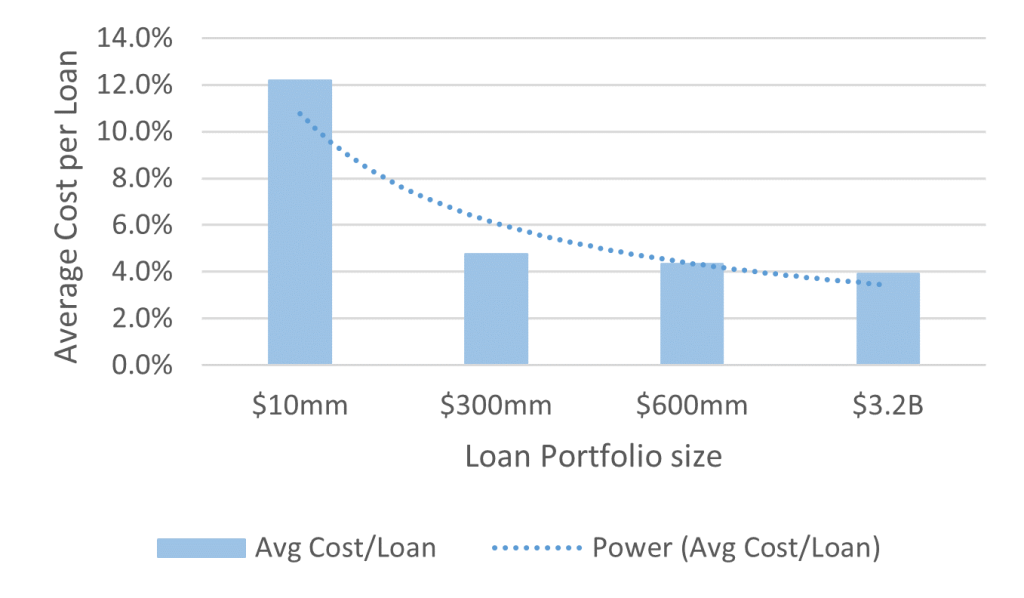
- The 80/20 rule works: As reflected in Chart C, in today’s environment a bank achieves significant cost savings when it reached approximately $300 million in loans, with incremental savings accruing as the portfolio grows.
Community Bank Cost Curves for 2000, 2006, 2009 and 2019

2019 Cost Levels by Loan Portfolio Size

Alabama Banks
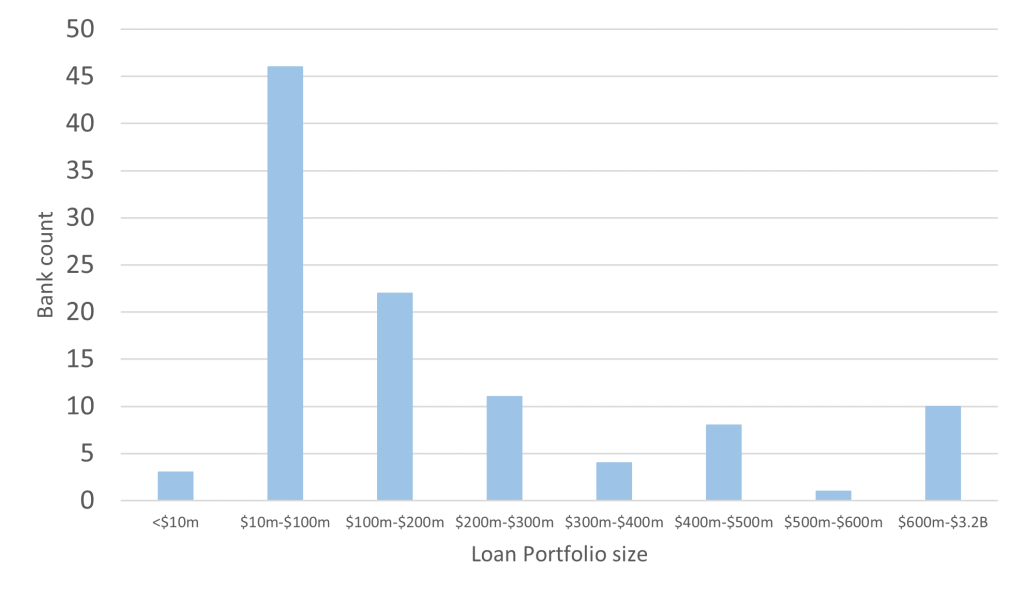
Chart D reflects the Q3 2020 loan portfolios of the 105 banks in our state. 82 of these banks have portfolios less than $300 million, indicating they could accrue significant cost savings from merging into a larger entity.
Alabama Community Bank Q3 20 Loan Size

Summary
A recently conducted study conducted by the FDIC covering nearly 120,000 Call Reports since 2000 indicate that in today’s market the optimal loan size for a community bank is $3.2 billion, and that very significant cost savings can accrue to banks with loan portfolios of $300 million or more. In Alabama, 82 of our 105 banks have loan portfolios less than $300 million, indicating banks in our state could generate meaningful cost savings by merging into larger banking entities.
2 Based on FDIC data, assume 90% of FDIC bank count are community banks
