I. Introduction
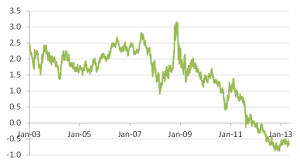
In an investment commentary published a year ago, we examined the cost of locking in a fixed stream of payments and found that the price of guaranteed returns had increased. Unfortunately, real interest rates have continued to fall and guaranteed returns are now even more expensive.
Figure 1: 10-Year US Treasury Rates (Real)

Many clients, particularly clients with a long investment horizon, ask “How much of my investment account can be spent and still maintain the inflation adjusted value of the account over time?” Clients frequently want to invest their portfolios in a manner that permits them to spend a given amount of their portfolios (often 5%) while leaving the corpus for future generations.
Since these investors have long time horizons, a portion of their accounts is typically invested in a mix of stocks and bonds. To figure out how much “income” can be spent, we need to make predictions about future returns. Predicting market returns always involves risk and uncertainty.
II. Predicting Future Returns
“It’s tough to make predictions, especially about the future.”
Yogi Berra
To estimate the returns on a portfolio, we typically break the return into two components: returns on the amount invested in stocks and returns on the amount invested in bonds.

Bond returns are easier to predict than stock returns because interest rates today are a good predictor of returns over time. Assuming that a bond does not default (or get called), the holder of a bond will earn a return based on the yield to maturity at the time of purchase.
Predicting future stock returns is fraught with risk. Because of the uncertainty of stock returns, we expect them to be higher over time than the returns on safer investments. We just don’t know how much higher. Like most economists, we have a solution for this problem (at least as far as this commentary goes): we will assume the problem away. For the purposes of our commentary here we will assume that stocks will earn 6% plus inflation. (We will discuss methods of estimating long term equity returns in a future commentary.)
III. Really, Only 6%?!!
The first thing that should cause pause for thought is that historical stock returns, after adjusting for inflation, have been rather modest. From January 1923 until March 2013, the S&P 500 returned almost 10% per year where inflation (CPI) was ~3%, and One-Month T-Bills earned 3.5%. This means that real returns on stocks have been about 7% per year and on T-Bills about .5% per year. If investors are trying to spend 4 to 5% of their account value and maintain the real value (i.e., adjusted for inflation) of their account, they must be willing to take equity risk, quite a lot of equity risk.
IV. What About Bonds?
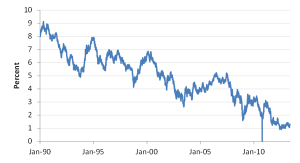
Since 1990, the Barclays US Government/Credit Bond Intermediate Index returned almost 6.4% per year, which compares favorably to both the S&P 500 index return of 8.5% and inflation (CPI) of 2.65%. Unfortunately, we cannot expect this level of returns on bonds going forward because much of the return during the period 1990 to 2013 has been due to falling interest rates.
Figure 2: 10-Year US Treasury Rates (Nominal)

Going forward, the return on bonds is almost certainly to be lower than in the past.
V. The Balanced Portfolio
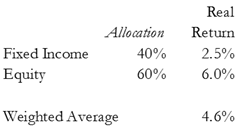
Two years ago, when we did this analysis for a 10 year outlook, bonds were yielding 2.5% after inflation. An investment with a “balanced” portfolio with approximately 60% in stocks could be expected to earn over 4.5%.

Note that the real return was below the 5% level of most spending policies.
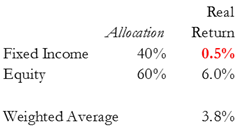
Unfortunately, the picture has gotten worse in the last few years. Not only have nominal interest rates fallen, but real yields (after inflation) have fallen as well (see Figure 1 above). Real returns on 10 year treasuries (Treasury Inflation Protected Securities) are now less than zero, or around “minus” 0.5%. Even if we assume that a bond investor can earn a slightly positive return after inflation, the picture for returns after inflation is bleak.

Without changing anything in the portfolio, our return expectations have fallen by almost 1% down to 3.8%, well below a 5% spending target.
An important assumption that we make here is that the expected equity return remains the same. As noted, we will consider this assumption in a future commentary.
VI. So Now What?
The current interest rate environment (and the actions of central banks around the world) have created an investment climate not seen for over 50 years. We caution the following:
- Traditional “rules of thumb” do not apply in today’s interest rate environment;
- Investors cannot maintain their same level of spending without taking more risk;
- If taking more risk is not an option (and we are not necessarily recommending more risk).
- Institutions either need to spend less or plan for their investments to decline in real value.
- Individuals need to adjust their expectations for changes in the value of their assets over their lifetime.
The Federal Reserve has been trying to help the economy recover by encouraging additional investment in riskier assets. This may be having the perverse effect of forcing investors to reduce spending (and economic activity) if they do not accept greater investment risk.
