As of February 2012, the low yield environment of the bond markets has lowered the expected return of fixed income securities as an asset class. Lower expected return for the fixed income asset class has necessitated a reassessment of whether client return goals can still be accomplished with the client’s current asset allocation. In some cases, the risk of the client’s asset allocation will need to be adjusted to increase risk if the return objective is not revised.
Utility stocks historically have played an important role in many investors’ “defensive” stock allocation because these companies have a relatively stable stream of earnings available for distribution to shareholders and relatively low sensitivity to broad stock market movements. In this paper, we evaluate the impact of an allocation to utility stocks to increase the expected return of the portfolio without substantially increasing the risk.
I. Lower Returns for Fixed Income
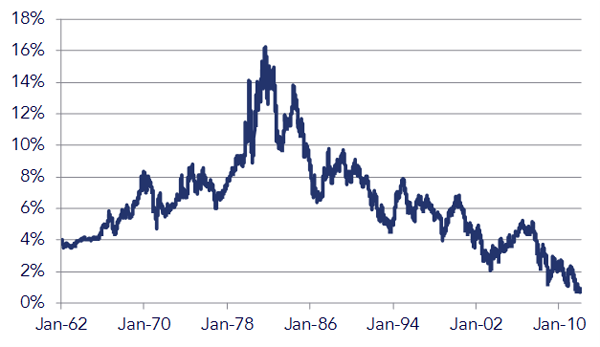
Figure 1: Historical Yield on 5-Year U.S. Treasuries
Daily Data from January 1, 1962 through February 23, 2012
A. Income Shortfall
Particularly for fixed income securities with low credit risk such as U.S. Treasuries, coupon payments may no longer be sufficient to meet the income requirements of the client. Investors with an individual bond holding that has recently matured have most likely had difficulty finding an investment that can produce the same income stream without subjecting the principal to additional risk.
B. Principal Exposure
Although bond fund investors do not face concentrated reinvestment risk like investors with a small number of individual bond holdings, they are exposed to interest rate risk. The saliency of interest rate risk exposure of fund investors may have faded because interest rates have been falling for over 30 years, resulting in capital appreciation and good returns. To put today’s historically low rates in context, Figure 1 presents the historical yield of 5-Year U.S. Treasuries. Figure 1 indicates that interest rates are currently at record low levels. However, interest rates have been at record low levels for an extended period of time and have continued to trend downward.
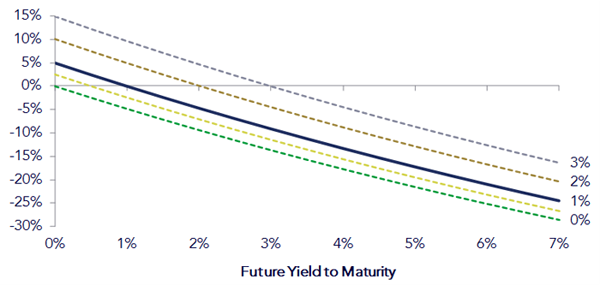
As a reminder of interest rate risk, Figure 2 presents the potential gain and loss of a bond with a maturity of 5 years with varying current yields to maturity and future yields to maturity (YTM), ignoring the income component of return. If the current YTM on the bond and the future YTM are the same, then the market value of the bond does not change. However, if market interest rates increase above the YTM at which the bond is purchased, then the market value of the bond will fall to reflect the ability of investors to purchase a bond with a higher YTM. Figure 2 illustrates that at current interest rate levels, the potential for gains from changing interest rates is limited, while the potential for loss is substantial. Each line plotted represents a different assumed yield to maturity at which a 5-year bond is purchased. The assumed yield to maturity at which the 5-year bond is purchased is indicated by the data label at the far right. For example, if we assume that we can buy a bond today with a YTM of 1%, the capital appreciation would be 5% if interest rates fell to 0%. However, the average historical daily yield on 5-Year Treasuries dating back to 1962 is 6.43%.[1] If the YTM were to rise to this level, the capital loss would be about 23%. Additionally, the magnitude of the gains and losses will be amplified (reduced) as the maturity of the bond increases (decreases).
Figure 2: Capital Gains and Losses for Varying Interest Rate Scenarios of a 5-Year Bond
Of course, bond fund investors also face reinvestment risk, although the risk is spread across a large number of securities with varying times to maturities so that the full impact of lower interest rates occurs slowly over time. The change in the market value of bonds as a result of changing interest rates has a more immediate impact.
II. Expected Return and Volatility of Utility Stocks
Current yields on fixed income securities in which PW&Co invests are substantially lower than the current yield on utility indices. Capital appreciation is an additional component of return that adds to the income component for stocks to equal the total expected return for stocks. Although the expected return on utility stocks is greater than that of fixed income, the volatility, or risk, of utility stocks[2] and the broader domestic stock market is higher as well, as illustrated in Figure 3 and Figure 4.[3]
Figure 3: Historical Growth of Wealth of the S&P 500, 5-Year Treasuries, and Utilities
Monthly Data from July 1926 through December 2011 on a Logarithmic Scale
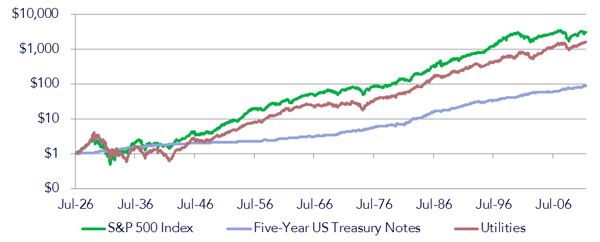
Although a large sample of data is desirable for forming expectations of the future, we look more closely at recent data due to the highly regulated nature of the utility sector and the impacts that regulation has had on the industry over time. The annualized monthly standard deviation for utility stocks, the S&P 500, and fixed income policy index[1] returns from January 1998 through December 2011 were 15.7%, 16.6%, and 4.0%, respectively. Thus, utility stocks have been much more volatile than fixed income but less volatile than the overall equity markets in recent history. Because utility companies distribute a large portion of earnings to shareholders, the risk of management wasting cash or making poor investment decisions is reduced. However, the expected return is also lower because the company is not reinvesting as much retained earnings in potential growth opportunities. Another important risk characteristic to point out is downside risk. The lowest annual return for utility stocks, which was for the twelve months ending February 2009, was a loss of 31%, while the S&P 500 dropped 43% over the same period.
Figure 4: Returns of Utilities, the S&P 500, and Fixed Income Policy Index
Annual Data from January 1998 through December 2011

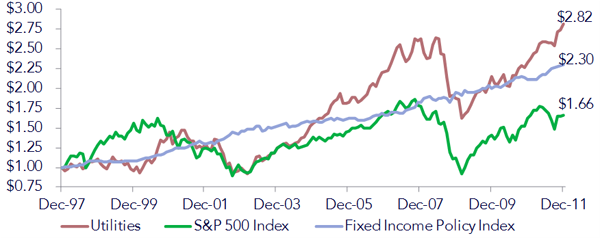
Utility stocks have clearly had strong returns recently as compared to both fixed income and the broad equity markets as illustrated by the growth of a dollar in Figure 5. One dollar grew to $2.82, $1.66, and $2.30, respectively, for utilities, the S&P 500, and fixed income.
Figure 5: Growth of a Dollar of Utilities, the S&P 500, and Fixed Income
Monthly Data from January 1998 through December 2011
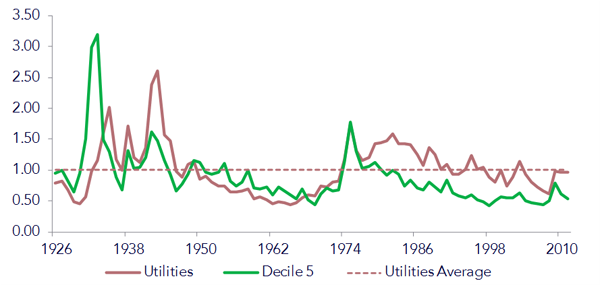
Although utilities have had a good run compared to the overall equity markets, valuation parameters indicate that the sector is not out of line with historical valuation multiples. The book-to-market ratio, which divides the accounting equity value by the market value of equity, indicates that utilities are not out of line with historical valuation ratios as displayed in Figure 6. Higher values indicate a greater exposure to the value risk factor and, thus, higher expected returns. The current book-to-market ratio is very close to its historical average.
Figure 6: Historical Book-to-Market Multiples[5]
Monthly Data from July 1926 through December 2011
III. Diversification Benefits
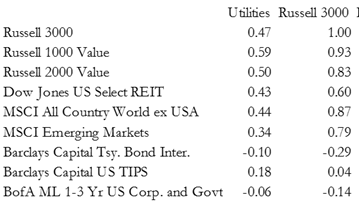
In addition to higher expected returns relative to fixed income, utilities exhibit lower correlations with other equity asset classes as shown in Table 1. For example, utilities have a correlation of 0.59 with domestic large value, while the broad domestic equity market, represented by the Russell 3000, has a correlation of 0.93. Utilities have a higher correlation with fixed income as compared with other equity asset classes.
Table 1: Correlations
Monthly Data from March 1997 through December 2011
IV. Pro Forma Portfolio Comparison
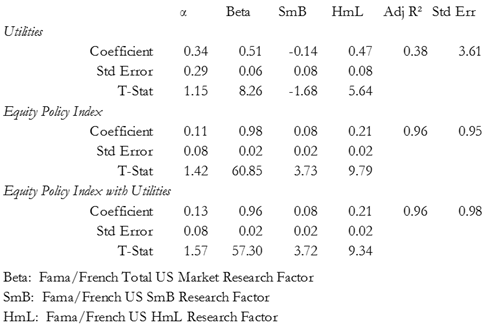
To form an expectation of the potential impacts of an allocation to utilities, we have compared our equity policy index with and without an allocation to utility stocks. The sample contains monthly returns from January 1999 through December 2011. To control for potential differences in risk between the portfolios, we have constructed the equity portfolio containing utilities to match the market, size, and value risk factors of our current equity policy index to the extent possible. The results of the regression are provided below in Table 2. The utilities returns are much less sensitive to changes in the overall equity markets as indicated by the smaller beta (0.51) compared to the current equity policy index beta (0.98). Additionally, the regression shows that utilities are tilted toward larger companies with more value risk factor exposure compared to the current equity policy index as indicated by the lower SmB and higher HmL coefficients, respectively. The low R2 value of utilities as compared to the equity policy index means that the independent variables do a poorer job of explaining the variation in the return of utilities. This result is not surprising since utilities are subject to regulatory risk that is distinct from the risks that most companies face.
Table 2: 3-Factor Regression Comparison
Monthly Data from January 1999 through December 2011
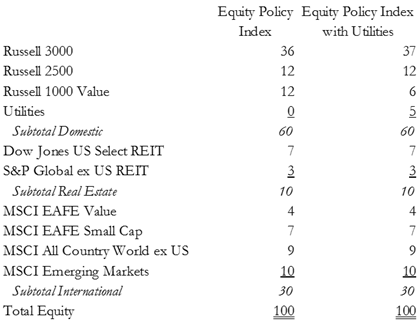
The resulting asset allocation after matching risk factor exposures is provided in Table 3 below. The only allocations that changed are domestic equity indexes. Because the utilities sector contains large companies with a value tilt with low market sensitivity as compared to the equity policy index, less weight was applied to the large value index (Russell 1000 Value) and slightly greater weight applied to the broad market (Russell 3000) to compensate for the 5% allocation to utilities.
Table 3: Asset Allocations
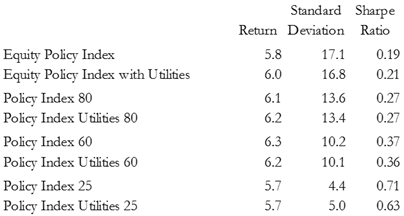
The pro forma performance comparison of the policy indexes for monthly returns from January 1999 through December 2011 is provided below in Table 4. The number in each of the labels indicates the percentage of equities used in the policy index. Utilities improve the risk-adjusted performance of the portfolios with a high allocation to equities. The benefit of utilities declines as the equity allocation declines, however. This result is driven by the low correlation of utilities with other equity asset classes, but higher correlation with fixed income as compared to other equity asset classes. An important implication of this result is that investors may be able to substitute some of their fixed income allocation for utilities and increase their expected return without a large increase in risk of the overall portfolio due to the low correlation of utilities with other equity asset classes.
Table 4: Pro Forma Performance Comparison
Monthly Data from January 1999 through December 2011
V. Portfolio Return Expectations
Although the pro forma results suggest inclusion of utilities for portfolios with large equity allocations, we do not rely solely on historical results to guide asset allocation decisions. Instead, we use expected return, volatility, and correlation assumptions to project future portfolio performance. We use the same methodology described in our white paper Expected Returns to derive our current assumptions for equity with and without utilities as well as fixed income. The assumptions are shown in Table 5. The expected return assumption for both equity portfolios is the same because we designed the portfolios to have the same exposure to the equity risk factors. The current yield on 5-Year U.S. Treasuries plus a premium for credit risk based upon current credit spreads is used to derive the fixed income expected return. The monthly standard deviation over the previous five years is the independent variable in a regression model used to derive the expected volatility of both equity and fixed income returns. Because the equity policy index including utilities has been less volatile over the last 5 years compared to the current equity policy index, the expected future volatility is slightly lower. The monthly correlation of returns over the last 5 years determines the correlation assumption.
Table 5: Equity and Fixed Income Return Assumptions

During 2011, the fixed income expected return had been 3.5%, which would have equaled an 8.44% expected return for a portfolio with an 80% equity allocation. As of February 2012, the portfolio expected return has fallen to 7.99%. Table 6 shows that the equity allocation must be increased to 85% to achieve the same portfolio expected return. The portfolio that includes utilities achieves the previous return objective, but with a slightly lower level of risk. If the portfolio is constrained on volatility, the equity portfolio with utilities allows for an increase in the equity allocation, which results in a higher expected return and a higher Sharpe Ratio.
Table 6: Projected Portfolio Returns

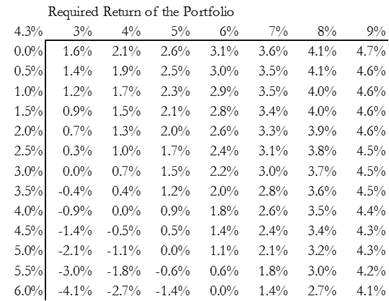
Utilities currently comprise about 3.5% of the S&P 500. Table 7 shows how the allocation to utilities[6] changes as the required return of the total portfolio and expected return of the fixed income asset class change. As the required return of the portfolio increases and expected return of fixed income decreases, the optimal allocation to utilities increases.
Table 7: Utilities Fund Allocation under Varying Return Scenarios
VI. Risks
A number of risks are involved with increasing the allocation to utilities, which ultimately may result in poorer risk-adjusted performance of portfolios. The utility sector is highly regulated and future changes to regulation could help or hurt the performance of utility companies. Another consideration for taxable investors is that dividends are currently tax-advantaged relative to interest income from fixed income investments. However, the favorable tax rates on qualified dividends are set to expire on December 31, 2012. There may be an implicit premium in the sector that could potentially disappear if the tax-advantaged status of dividends relative to interest income disappears. Absent transaction costs, investors should be indifferent between realizing a capital gain to provide income and receiving a dividend, but this may not be the manner in which they behave.
VII. Recommendation
We have demonstrated that including utilities improves both the pro forma and projected risk-adjusted returns of the current equity portfolio. Utilities are a nice complement to portfolios containing a large allocation of fixed income because they increase the expected return of the portfolio. Because utilities are less volatile than other equity asset classes, the increase in volatility of the portfolio is dampened. Additionally, utilities are a good complement to portfolios containing a large equity allocation because their low correlation with other equity asset classes reduces portfolio volatility.
[2] Source: CRSP value-weighted industry returns represent the utility asset class throughout this paper. The data was sourced from Ken French’s website: http://mba.tuck.dartmouth.edu/pages/faculty/ken.french/data_library.html.
[3] Volatility, as measured by standard deviation, is an important, but incomplete, measure of risk.
[4] Policy index is a portfolio of indices that represent the risk factors of the investments held in portfolios.Fixed income policy index: 50% Barclays Capital Treasury Bond Index, 25% Barclays US TIPS Index, 25% BofA Merrill Lynch 1-5 Year US Corporate and Government Index.
[5] Source: CRSP database. Decile 5 is the breakpoint for the 50th percentile of stocks and is used here to represent the central tendency of the overall market.
[6] This percentage does not consider allocations to utilities in funds already in the equity portfolio. [WP 34.1]
