After falling just over 50% from its peak in October 2007, the S&P 500 has posted strong gains since the market low in March 2009. While the market meltdown in late 2008 and early 2009 is now becoming a not-so-recent memory, many are wondering if the S&P 500 has recovered.[1] Unfortunately, as of this writing, it has not.
I. Largest Historical Periods of Market Decline Since 1926
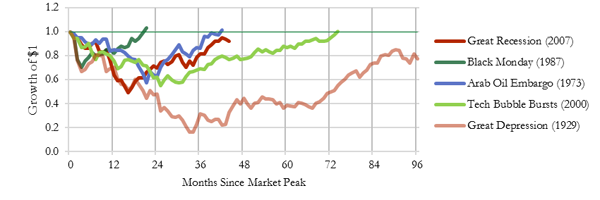
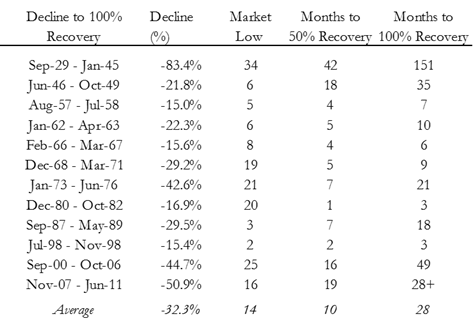
The 2008 global financial crisis is one of 12 periods since 1926 when the S&P 500 declined by more than 15% from the market high as of the month end preceding the first month of a decline (Table 2 in Appendix). The five largest decline periods[2] are summarized in the graph below.
Figure 1: Downturn and Recovery

The current “Great Recession” has been larger in magnitude and has had a longer recovery period than both the period following Black Monday in 1987 and the Arab Oil Embargo in 1973. For a short time, the current recovery closely followed the 1973 to 1974 period. The current market recovery could still happen more quickly than the Tech Bubble Burst, where the decline was not as deep but recovery took much longer.
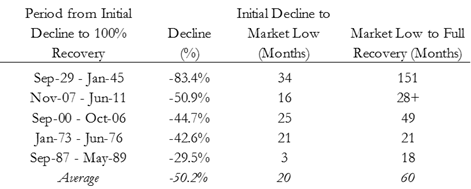
The initial market decline of the “Great Recession” has an eerie resemblance to the Great Depression as both had a trough 16 months in and started to recover over the next two months. As shown in the table below, however, the Great Depression market had a double dip, and ultimate recovery took 151 months, or 12.5 years (which is not entirely shown in the graph above).
Table 1: Largest Market Declines Since 1926

The current market recovery, however different the circumstances, does not really stand out as markedly different from past major declines.
II. Is this a “New Normal?”
In the aftermath of the largest stock market decline since the Great Depression, many investors speak of a “new normal,” a fundamental change in the stock market characterized by below-average equity returns and sluggish economic growth. The idea of a “new normal” environment following a market decline is nothing new; rather, following major market recoveries throughout the 20th and 21st centuries, investors have been reluctant to return to the stock market out of fear of another massive decline or lack of confidence in the fundamentals that formerly drove their investment decisions.
The most recent economic recession is associated with the second largest stock market decline since 1926, with companies in the S&P 500 losing almost 51% of their value from October 31, 2007 to February 2009. In early 2009, economists and investment professionals spoke of a “new normal” for stocks. Those who heeded the advice of the “professionals” missed out on a 92% stock market rally from February 2009 to June 2011. Disciplined investors who stayed true to their long term investment philosophy and stayed in the markets may have lost a few years of compounded return, but have their “nest egg” restored almost fully intact.
III. Is Modern Portfolio Theory Dead?
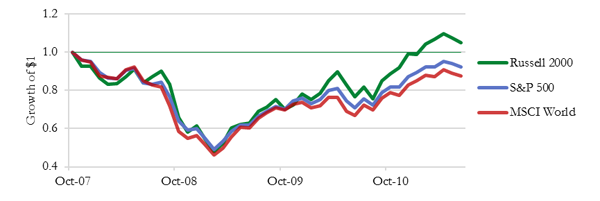
Another element of the “new normal” philosophy is that diversification is not working and that “Modern Portfolio Theory” is dead. While it is true that the major indices (S&P, Russell 2000, and MSCI World) all had similar selloff patterns and reached a low at the end of the same month, their recovery patterns started to diverge at the end of October 2009. The Russell 2000, in particular, has fully recovered. The returns of these major indices[3] are shown in the chart below.
Figure 2: Recovery of Major Indices

We will consider the relative performance of these additional indices during previous recovery periods in a future investment commentary.
Another important element of diversification of any portfolio is the fixed income allocation. High-grade fixed income provided significant diversification benefits during the “Great Recession.”
IV. Conclusion
Many economists and fund managers in early 2009 spoke of a “new normal.” Investors who listened and exited equities missed out on a 92% gain in the S&P 500 from March 1, 2009 to June 30, 2011. We believe that
- The current crisis and recovery, while dramatic, are not without historical precedent;
- The concept of a “new normal” put forth in early 2009 may be applicable to fundamental changes in the US economy, but it has not stood up to subsequent events in the stock market; and
- Investors can still benefit greatly from the principles of diversification and modern portfolio theory.
While the complexity of financial products and company values continues to increase, the previous recession tells us nothing about future stock market performance. Stock prices always fall in January, until they don’t. Gold always increases in value, until it doesn’t. Investors who stay true to their disciplined long term investment plan may ride out the economic storm slightly battered, but hopefully wiser.
V. Appendix
Table 2: Stock Market Declines Greater than 15%

VI. Important Notice
- Past performance is not a guarantee of future results. Values change frequently and past performance may not be repeated. Even a long-term investment approach cannot guarantee a profit. Economic, political, and issuer-specific events will cause the value of securities, and the portfolios that own them, to rise or fall.
- Indices are not available for direct investment; therefore, their performance does not reflect expenses associated with management of an actual portfolio.
- Historical performance results for investment indices, or categories, generally do not reflect the deduction of transaction or custodial charges or the deduction of an investment management fee, the incurrence of which would have the effect of decreasing historical performance results.
- Information presented is believed to be factual and up-to-date, but we do not guarantee its accuracy and it should not be regarded as a complete analysis of the subjects discussed. All expressions of opinion reflect the judgment of the authors as of the date of publication and are subject to change.
- Economic factors, market conditions, and investment strategies will affect the performance of any portfolio and there are no assurances that it will match or outperform any particular benchmark.
[2] A decline period is the initial month of decline from the previous high to the relative market low.
[3] Indices: S&P 500, Russell 2000, and MSCI World (Gross Dividends). [IMC 7]
