The Wall Street Journal ran a periodic column a few years ago that compared the performance of some of the best stock pickers to that of monkeys throwing darts at a page of stock listings. After some time, the “monkeys” had done so well that interest in the column waned. How did the monkeys “beat the market?”
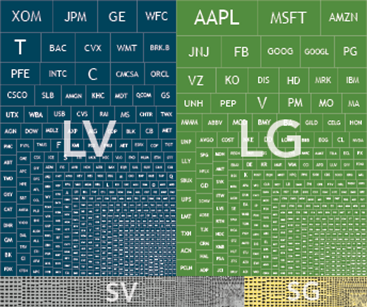
To answer the question we first need to understand what we mean by a market portfolio.” Exhibit 1 shows the components of the Russell 3000 Index, considered a good representation of the US stock market. Each stock in the index is represented by a box, the size of which represents the stock’s total market value or market capitalization. The most valuable company in the index is currently Apple, so its box is larger than all the others. The boxes are also color coded based on their relative market capitalization and whether they are value or growth stocks. Blue represents large cap value stocks (LV), green is large cap growth stocks (LG), gray is small cap value stocks (SV), and yellow is small cap growth stocks (SG).
Exhibit 1: US Stocks Sized by Market Capitalization

For illustrative purposes only. Illustration includes constituents of the Russell 3000 Index as of December 31, 2016, on a market-cap weighted basis segmented into Large Value, Large Growth, Small Value, and Small Growth. Source: Frank Russell Company is the source and owner of the trademarks, service marks, and copyrights related to the Russell Indexes.
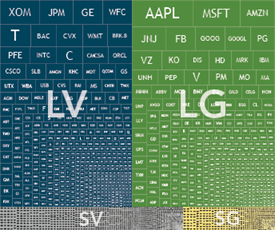
A monkey throwing darts at a newspaper (or at least one published years ago when people looked at newspapers for stock prices) would just see a list of stocks, without any indication of market capitalization or size. Exhibit 2 represents the monkey’s page of stock listings. The boxes represent the same stocks shown in Exhibit 1, but instead of each stock being weighted by market cap, the companies are equal weighted.
Exhibit 2: US Stocks Sized Equally

For illustrative purposes only. Illustration includes the constituents of the Russell 3000 Index as of December 31, 2016 on an equal-weighted basis segmented into Large Value, Large Growth, Small Value, and Small Growth. Source: Frank Russell Company is the source and owner of the trademarks, service marks, and copyrights related to the Russell Indexes.
The differences between the pictures are noticeable. In Exhibit 1, the picture is dominated by large value and large growth (blue and green) stocks. In Exhibit 2, small cap value stocks dominate (gray). It is much more likely that a monkey will hit a small stock than a large stock, and the dart will have the highest probability of landing on a small value stock.
Historically over time, small company stocks have higher expected returns than large company stocks, and value stocks offer higher expected returns than growth stocks. Because Exhibit 2 has a greater proportion of its surface area dedicated to small cap value stocks, the monkey’s darts will be more likely to land on stocks that have higher returns thereby producing a portfolio with superior returns on average.


This doesn’t mean that the monkeys have created a reliable way of investing. The monkeys throwing darts in the Wall Street Journal were not actually buying stocks or incurring trading costs which can be very high for small-cap value stocks. You are more likely to increase your chances for investment success by understanding how to best design a portfolio to capture drivers of return, understanding what a sufficient level of diversification is, and understanding how to contain trading costs. Even well-constructed portfolios pursuing higher expected returns will have periods of disappointing results. It would be easy to imagine that you might lose faith in your dart throwing monkey if his portfolio wasn’t performing well in the short term.
Important Note
Concepts in this commentary come from published commentary of Dimensional Fund Advisors LP. There is no guarantee investment strategies will be successful. Investing involves risks including possible loss of principal. Diversification does not eliminate the risk of market loss. All expressions of opinion are subject to change. This article is distributed for informational purposes, and it is not to be construed as an offer, solicitation, recommendation, or endorsement of any particular security, product, or service.
