This report explores recent valuation trends in the public and private markets, directed to small and middle market business owners and the professionals and financial institutions that serve them. The review is designed to provide realistic guidance on the question “What’s it Worth?,” keeping in mind that proper preparation for real world transactions requires analysis of specific situations based on up to date data. This is the second edition of the Porter, White & Company Valuation Review, which is published quarterly.
I. Overview
U.S Middle-market private equity activity remained strong in Q1 2015, continuing from its record year in 2014. In Q1 2015, over 75% of all private equity buyouts occurred in the middle market. [i] This trend seems likely to continue throughout 2015 as middle-market fundraising activity in 2014 was the highest since the recession. The continued abundance of liquidity will likely keep deal prices elevated for the near term, which is good news for sellers. Alabama has been slow to recover from the recession, but at PW&Co, we have finally begun to see an uptick in businesses looking to grow – raising growth capital or expanding through acquisition – a positive sign for the Alabama economy.
II. Valuation Multiples in M&A Deals
Multiples of middle-market companies (defined here as companies with transaction values be-tween $25M and $1B) have remained strong in 2015, as shown in Figure A below. This is consistent with what we are hearing from private equity professionals around the country. Middle-market companies sold for an average of 10.2x trailing twelve month EBITDA during Q1 2015, consistent with transactions during Q1 2014. The target companies were purchased (on average) at a 44 percent premium above the book value, an increase from Q1 2014.
Figure A: Valuation Multiples in Middle-Market M&A Deals [ii]

III. Publicly Traded Valuation Multiples
Private transaction multiples are the most direct evidence of valuations in the private markets. However, public markets also provide an important view of valuation metrics and show how sophisticated investors currently view and quantify risk in a given company, industry, or geography. The current P/E ratio (current price divided by latest 12 month earnings) of the S&P 500 index increased to 20.5 at the end of March 2015, up from 19.5 one year prior. The Shiller P/E ratio (current price divided by average earnings over 10 years) also increased to 26.9 from 25.0 over the same time period.
Figure B: Publicly Traded Valuation Multiples Over Last 10 Years [iii]

IV. Industry Snapshot – Healthcare
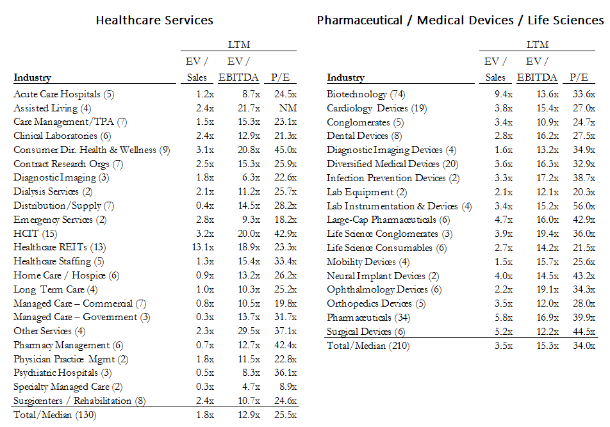
The Healthcare Industry attracted almost $60 billion in invested capital last year, and the industry hasn’t slowed down yet in 2015. At PW&Co, we have assisted healthcare organizations with strategic advisory, merger and acquisition advisory, and advice on capital-raising across the spectrum of medical device, pharmaceutical development and diagnostics, and healthcare technology and services. The Healthcare sector consists of companies engaged in manufacturing medical supplies, equipment and pharmaceuticals, as well as operating healthcare facilities or providing services to health care providers. The following table summarizes the public valuation multiples for segments of the healthcare industry as of Q1 2015.
Figure C: Healthcare Valuations [iv]

[ii] Figure A. Source: Factset, Flashwire US Monthly, April 2015, accessed May 20, 2015
[iii] Figure B. Source: Multpl.com, accessed May 5, 2015
[iv] Figure C. Source: Duff & Phelps, Healthcare Sector Review – April 2015
